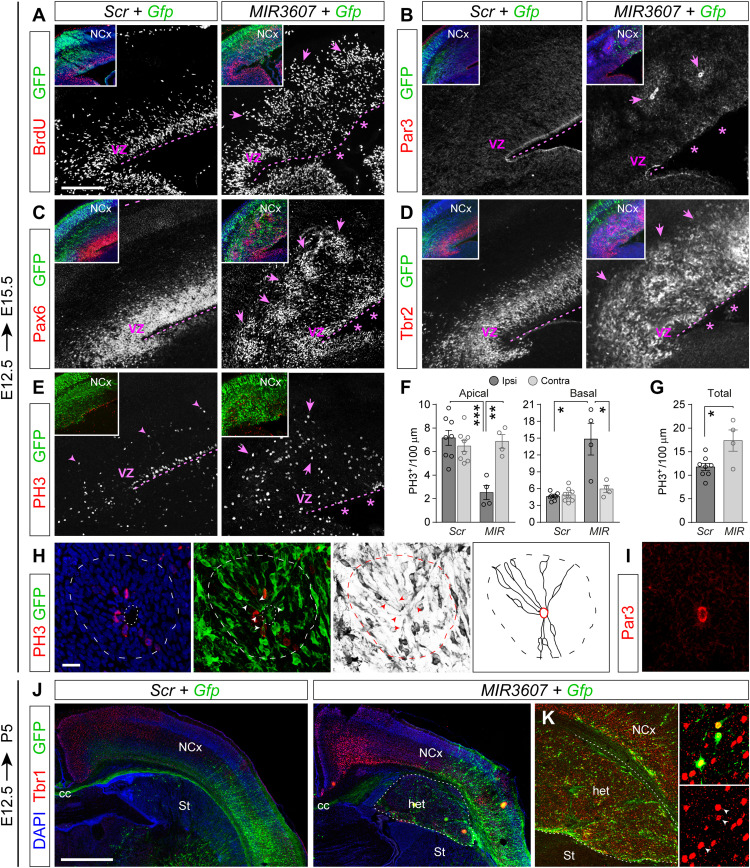
Fig. 7. MIR3607 overexpression drives expansion of aRGCs and formation of rosettes leading to subcortical heterotopia.
(A to D) Parietal cortex of mouse embryos electroporated at E12.5 with the indicated plasmids, analyzed at E15.5 and stained with the indicated markers. Asterisks indicate disrupted organization of VZ and Par3+ adherens junction belt. Arrows indicate rosettes. Insets are low magnifications of the same areas showing DAPI (blue) and GFP. (E to G) Distribution and quantification of mitotic cells in E15.5 embryos electroporated at E12.5 with the indicated plasmids. Histograms indicate means ± SEM for the electroporated (Ipsi) and non-electroporated, contralateral hemisphere (Contra). Circles in plots indicate values for individual embryos. Decreased apical mitoses (asterisks) and increased basal mitoses (arrows) are indicated. N = 4 to 8 sections from two to four embryos per group; t test; *P < 0.05, **P < 0.01, and ***P < 0.001. (H and I) Details of a rosette (dashed line) stained as indicated. Dotted line indicates inner lumen; arrowheads indicate apical processes of aRGCs, Par3 reveals the luminal surface (I). Schematic drawing shows line reconstructions of GFP+ aRGCs within the rosette, with apical processes radiating from the inner lumen (red). (J and K) Cortex of P5 mouse pups electroporated at E12.5 with the indicated plasmids and stained as indicated. Tbr1+ neurons (red) are abundant in the heterotopia (het) of MIR3607-expressing brains (K) between the normal neocortex (NCx) and striatum (St), including many GFP+ cells (arrowheads in insets). Scale bars, 200 μm (A to E), 10 μm (H), and 1 mm (I).

