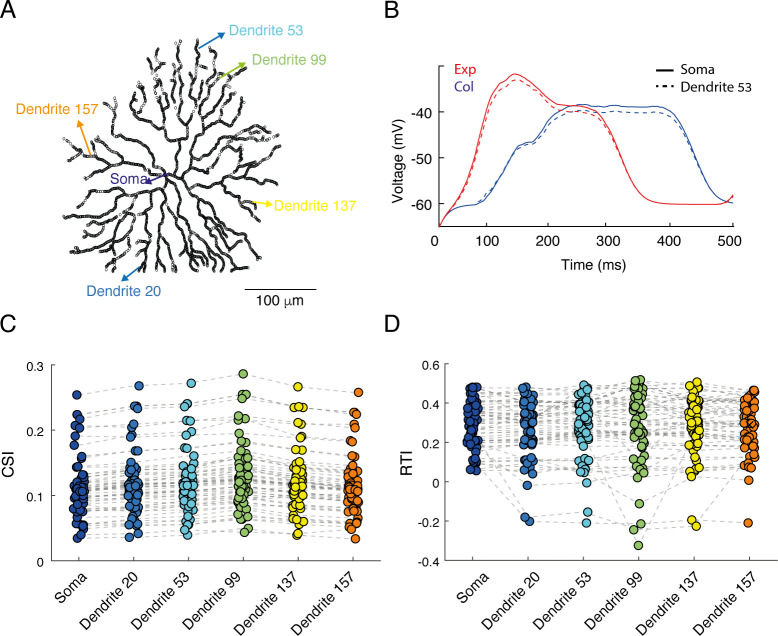
Fig 4. Comparison of SAC direction selectivity in the soma and distal dendrites.
A. An image of the reconstructed SAC showing the locations used for the simulated voltage recordings, from the soma and from 5 dendritic locations. B. Somatic recording and the recording from one dendritic location (#53) are superimposed. C-D. comparison of the CSI (C) and RTI (D) values across locations. Dashed grey lines denotes values from the same cells (n = 68).

