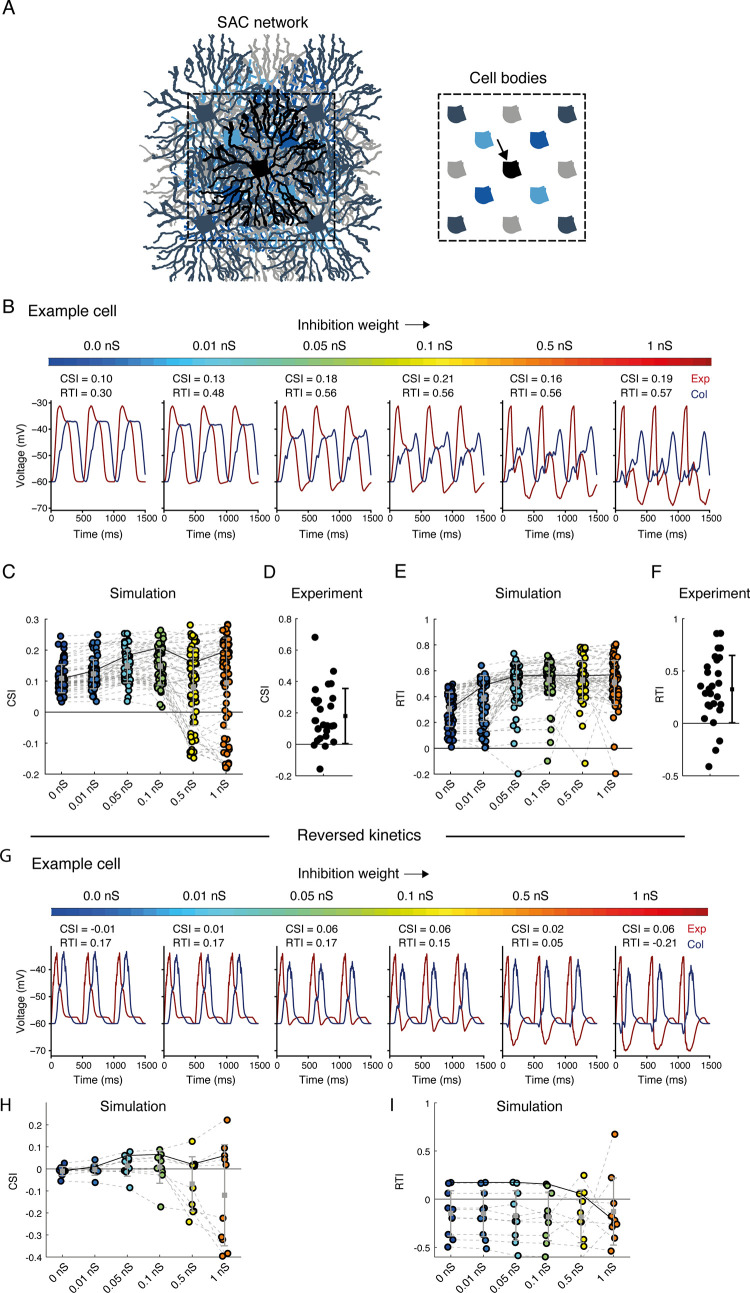
Fig 5. Effects of reciprocal inhibition on SAC CF preference.
A. Simulated SAC network, consisting of two layers of replicated SAC sheets (scales of grey and blue). Right: illustration of all cell bodies plotted for clarification. The recorded simulated SAC (black, indicated by an arrow) resides in the center of the network. B. The voltage response of an example simulated central SAC (same as simulated SAC 1 from Fig 3) to expanding (red) and collapsing (blue) rings, shown for six different inhibition weights (colormap on top). C. The CSI of a population of simulated SACs (n = 76) embedded in SAC networks with different inhibition weights. Grey solid line represents the CSI values of the example SAC shown in B. Black solid line represents the mean CSI value. D. The CSI of the experimentally recorded SAC population (n = 27 cells). The dot and whiskers on the right denote mean±STD. E. Same as C but for RTI values. F. Same as D but for RTI values. G-I. As in B, C, E but for simulated SACs with reversed spatiotemporal excitation: transient in proximal and sustained in distal processes.

