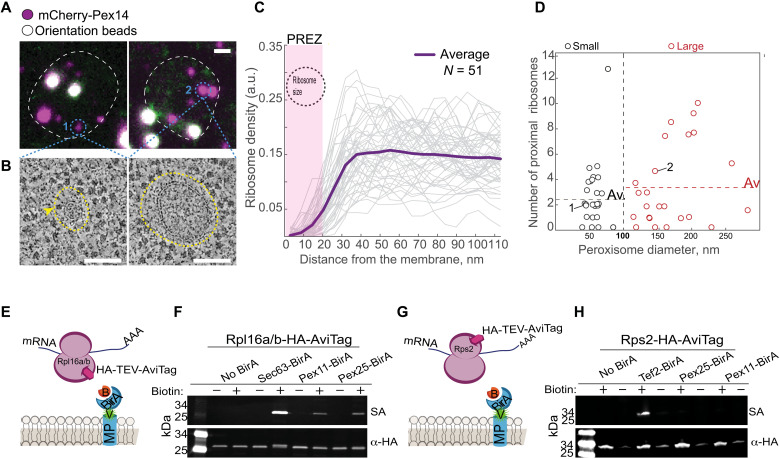
Fig. 2. A subset of ribosomes is proximal to the peroxisomal membrane despite a REZ.
(A) Fluorescent micrographs of yeast. Peroxisomes (small-1 or large-2) in magenta (mCherry-Pex14). TetraSpeck beads (white) used for correlation. Scale bar, 1 μm. (B) Electron tomograms of peroxisomes from (A). Surrounding each peroxisome is a peroxisomal ribosome exclusion zone (PREZ; yellow dashed line). Yellow arrowhead shows ribosomes adjacent to the membrane. Scale bar, 100 nm. (C) Graph of ribosome density (each gray line = one peroxisome) as a function of distance from the membrane. The PREZ (yellow dashed line) is approximately the ribosome size (black circle). n = 51. a.u., arbitrary units. (D) Modeled peroxisome size distributions separate small (~50 nm diameter) and large (>100 nm diameter) peroxisomes. Dashed line is the average number of proximal (>20 nm from membrane) ribosomes in each group. “1” and “2” are peroxisomes from (A). n = 51. (E) Schematic representation of the proximity labeling assay. An abundant membrane protein (MP) fused to mVenus (v, green) and BirA (blue crescent) in cells that express Rpl16a/b fused to HA followed by a Tobacco Etch Virus (TEV) protease–cleavable AviTag. The AviTag is biotinylated upon addition of biotin (B, orange) only in ribosomes that are proximal (less than 10 nm) to the BirA-fused MP. (F) Western blot analysis of cells described above on the background of either Sec63 (ER-MP, positive control), Pex11, or Pex25 (abundant PMPs) fused to mVenus-BirA. Biotinylation detected by fluorescent streptavidin (SA; green). α-HA antibody used as loading control (red). (G) A schematic representation of (H) that is similar to (E), but HA-TEV-AviTag is fused to Rps2. (H) Western blot analysis as in (F) but with Rps2-AviTag. Cytosolic protein Tef2 is a positive control.

