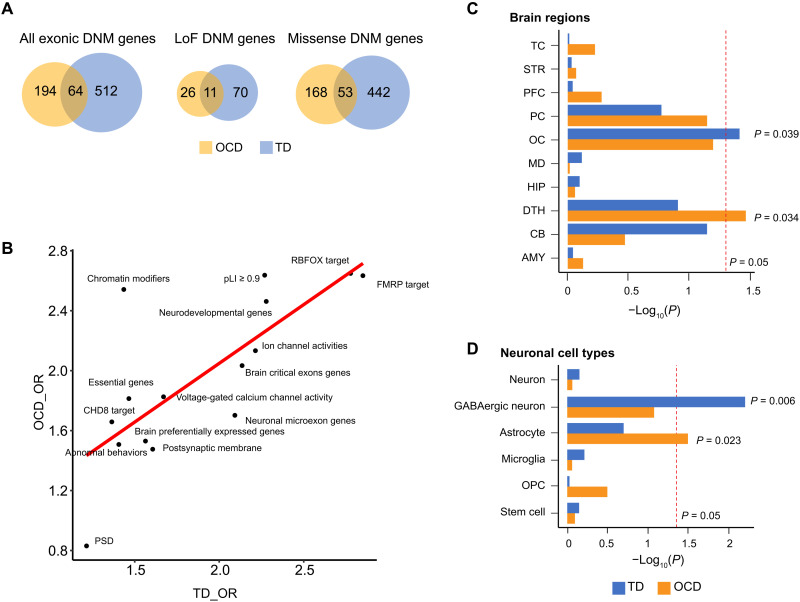
Fig. 4. Comparison of genes affected by coding mutations in OCD and TDA.
(A) Venn plots showing the relationships between TD DNM–affected genes (curated from three studies) and OCD DNM–affected genes [both DNMs from Cappi et al. (10, 11) and the current study]. (B) Correlations between gene-set enrichments of TD DNM and OCD DNM–affected genes, which were not introduced by similarity or dependency between functional gene sets (average Jaccard similarity index = 0.025). Each dot represents one of the 15 manually curated gene sets (Supplementary Materials and Methods). The X axis represents the OR of TD DNM gene enrichment within this gene set, and the Y axis represents that of the OCD DNM–affected genes. Rs and P values were calculated using Pearson’s correlation analysis. (C and D) Distinct expression patterns of TD and OCD genes among (C) brain regions and (D) brain cell types. Red lines indicate the nominal P value threshold (0.05). TC, temporal cortex; STR, striatum; PFC, prefrontal cortex; PC, parietal cortex; OC, occipital cerebral wall; MD, mediodorsal nucleus of the thalamus; HIP, hippocampus; DTH, dorsal thalamus; CB, cerebellar cortex; AMY, amygdala.

