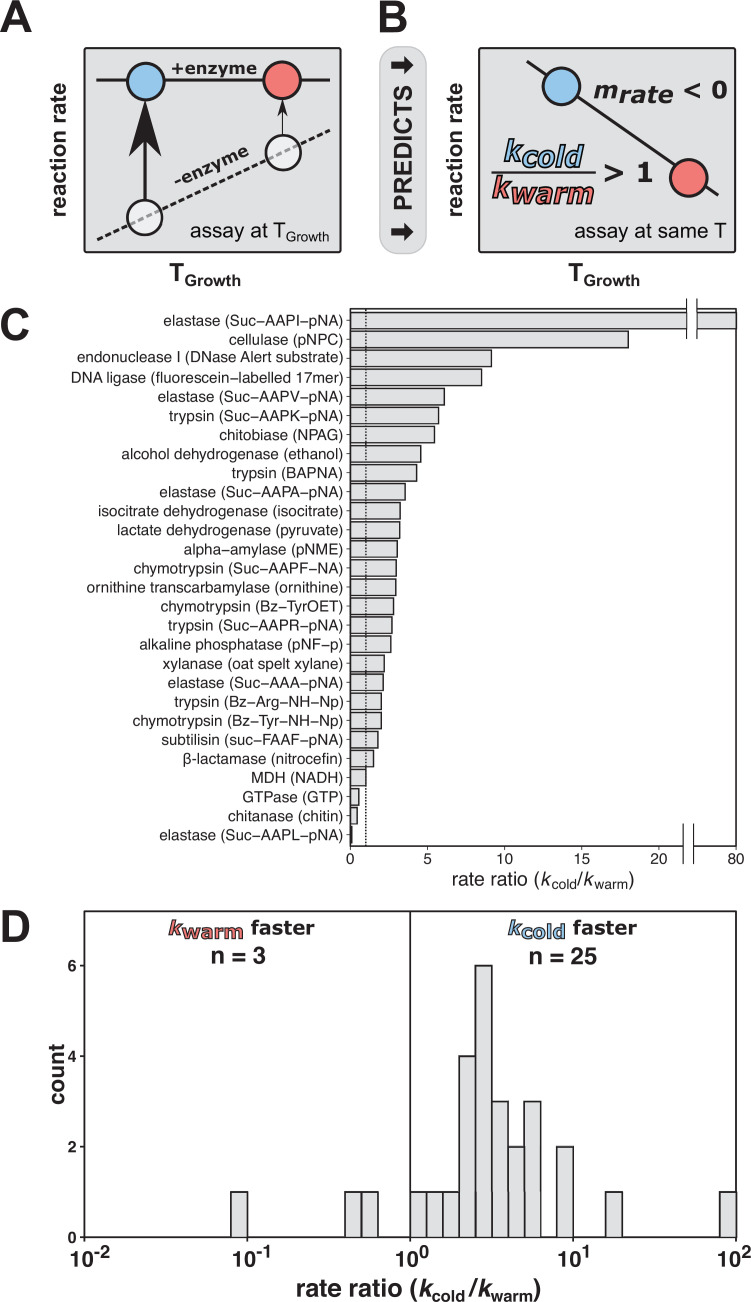
Figure 1. The rate compensation model of cold adaptation predicts that cold-adapted enzymes exhibit greater catalysis and are faster at a common temperature than their warm-adapted counterparts.
(A) According to the rate compensation model of cold adaptation, a cold-adapted variant (blue circle) has larger rate enhancement than a warm-adapted variant (red circle). The dashed line represents the uncatalyzed reaction, the solid line represents the catalyzed reaction, and the arrows represent the rate enhancement at the respective organism TGrowth. (B) When variants are assayed at a common temperature, rate compensation predicts a faster reaction for the enzyme from the cold-adapted organism, corresponding to a rate ratio (kcold/kwarm) of greater than one and a negative slope of rate vs. TGrowth (mrate). (C, D) Rate comparisons of warm-adapted and cold-adapted enzyme variants made at identical temperatures from cold adaptation literature spanning indicated reactions with substrate specified in parentheses (Collins and Gerday, 2017; Feller and Gerday, 1997; Siddiqui and Cavicchioli, 2006; Smalås et al., 2000). The black vertical lines represent no rate enhancement change with temperature (i.e., rate ratio = 1).

