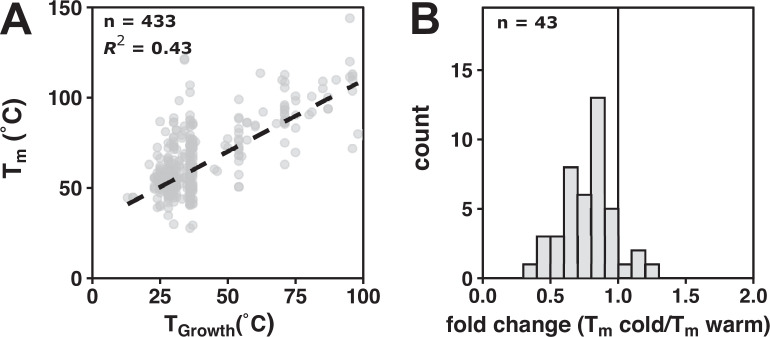
Figure 4. Protein stability data display stability compensation.
(A) Wild-type Tm stability data from ProThermDB as a function of organism TGrowth. Dashed black line represents a linear fit (n = 433, R2 = 0.43). (B) Fold change (Tm cold/Tm warm) of wild-type protein variants (n = 43, median = 0.81, 95% [0.70, 0.85]). The black vertical line represents no change (i.e., fold change = 1).

