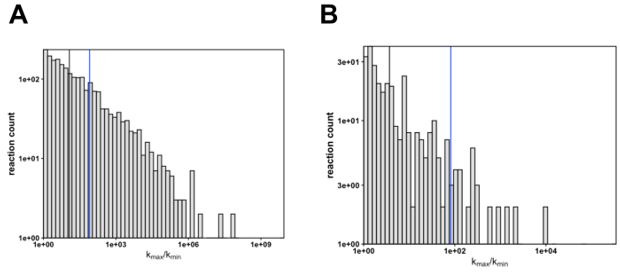
Author response image 1. Differences in rate constants between enzyme variants.

(A) The fold change in kcat (kmax/kmin) of enzyme reactions (n = 2223). The black line indicates the fold change median value (median kmax/kmin = 11.8) and the blue line indicates the fold change value of KSI (kmax/kmin = 82). (B) The fold change in kcat (kmax/kmin) of enzyme reactions measured at 37°C (n = 319). The black line indicates the fold change median value (median kmax/kmin = 3.7) and the blue line indicates the fold change value of KSI (kmax/kmin = 82); while the median is much smaller there remain a number of enzymes with fold change values similar or larger than the KSIs.
