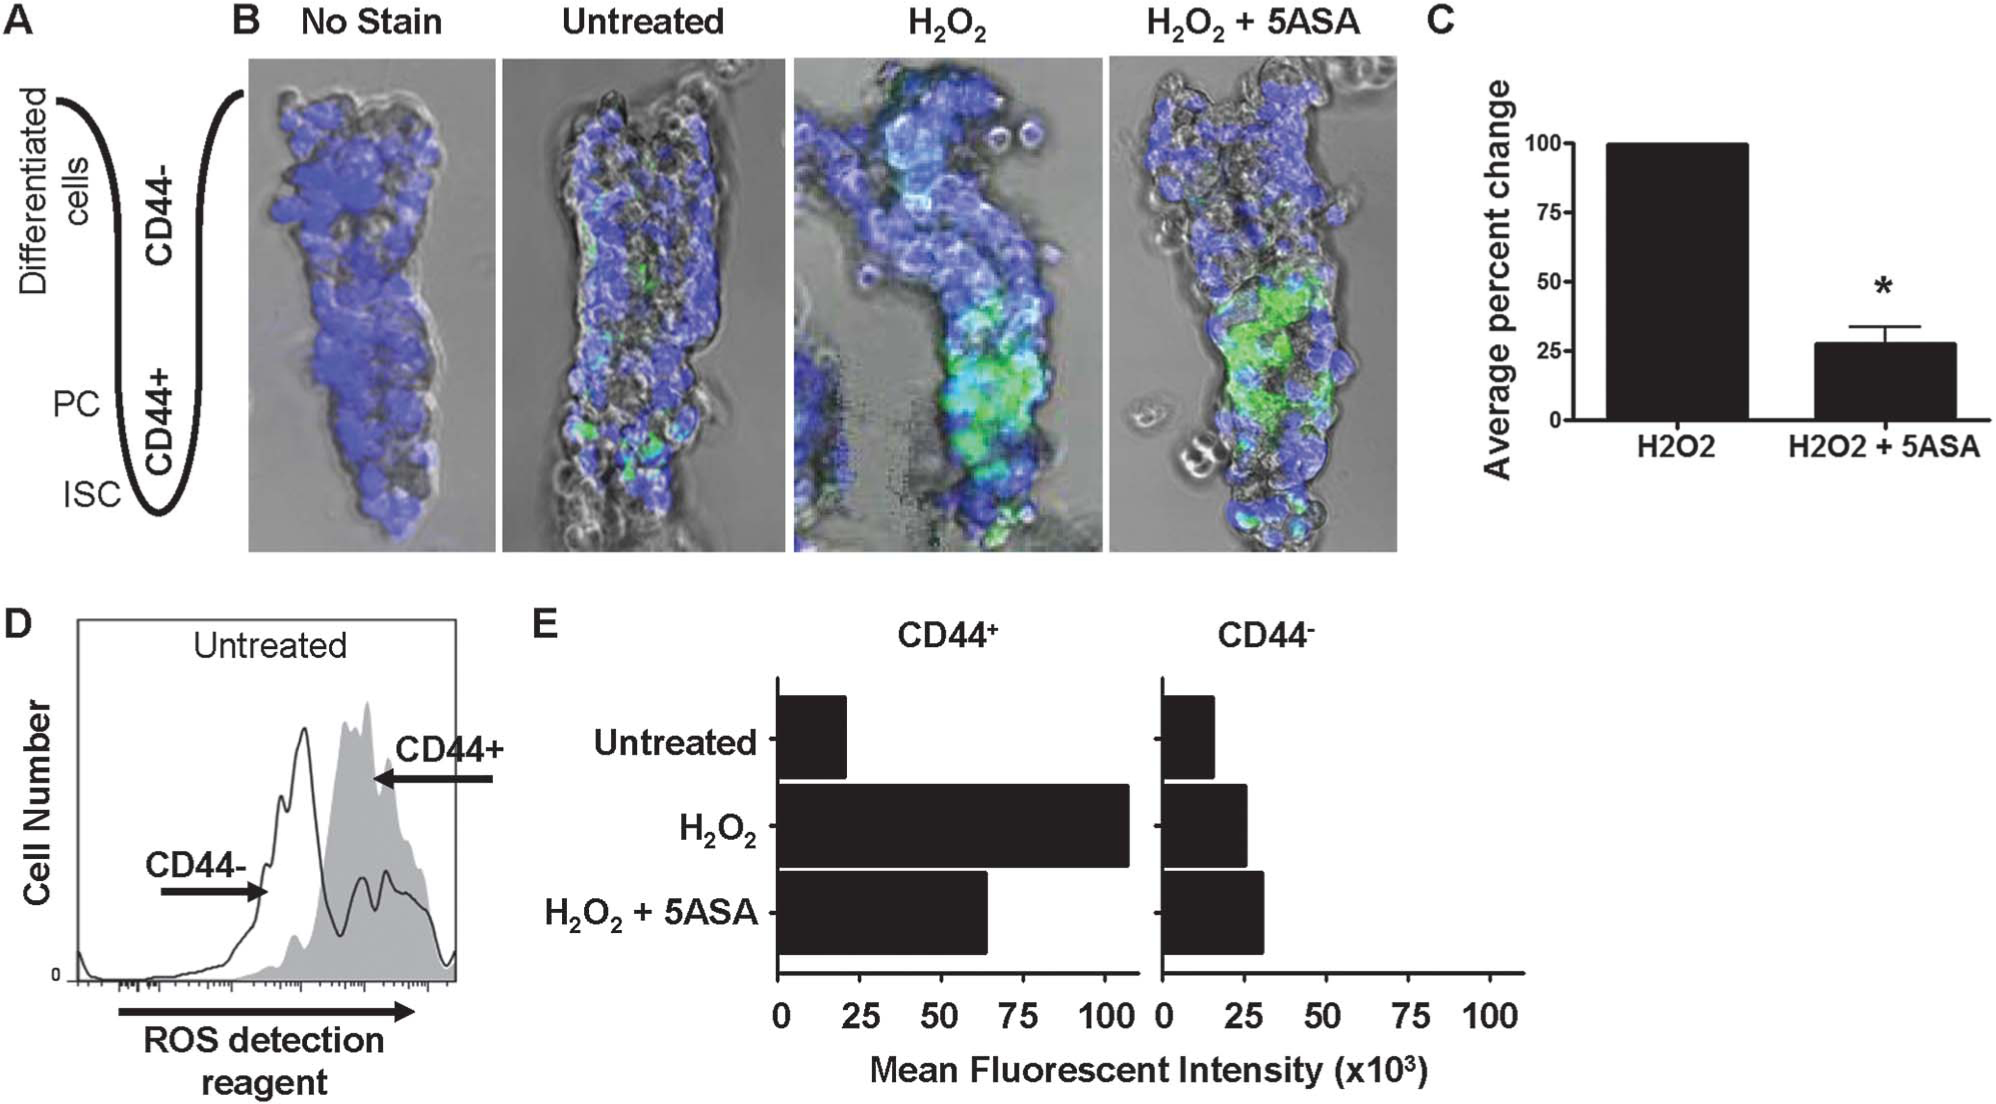
FIGURE 1.

Basal ROS is elevated in intestinal PC. A, Cartoon of colon crypt showing the orientation of the intact crypts that were isolated from mice and imaged by live-cell fluorescent and light microscopy where CD44− differentiated IECs are at the top and CD44+ ISC/PC are at the bottom. B, Images of intact colonic crypts treated with H2O2 with or without 5-ASA stained with the ROS detection reagent (green) and DRAQ5 (blue pseudocolor) to stain all nuclei. Some crypts were not stained with the ROS detection reagent or treated with H2O2 as controls. C, Percent change in the relative fluorescent intensity of ROS detection reagent staining between H2O2 with or without 5-ASA. Crypt images were analyzed in ImageJ, and calculations were performed using peak values in the lower crypt. Average value of 3 independent experiments is shown (*P < 0.05). D, Flow cytometry data showing the number of ROS detection reagent–stained mouse colon IEC. Live, CD45−, CD44+ cells were gated on to determine the mean fluorescent intensity of each cell population, as shown in E of ROS detection reagent–stained cells untreated or treated with H2O2, with or without 5-ASA.
