
FIGURE 5.
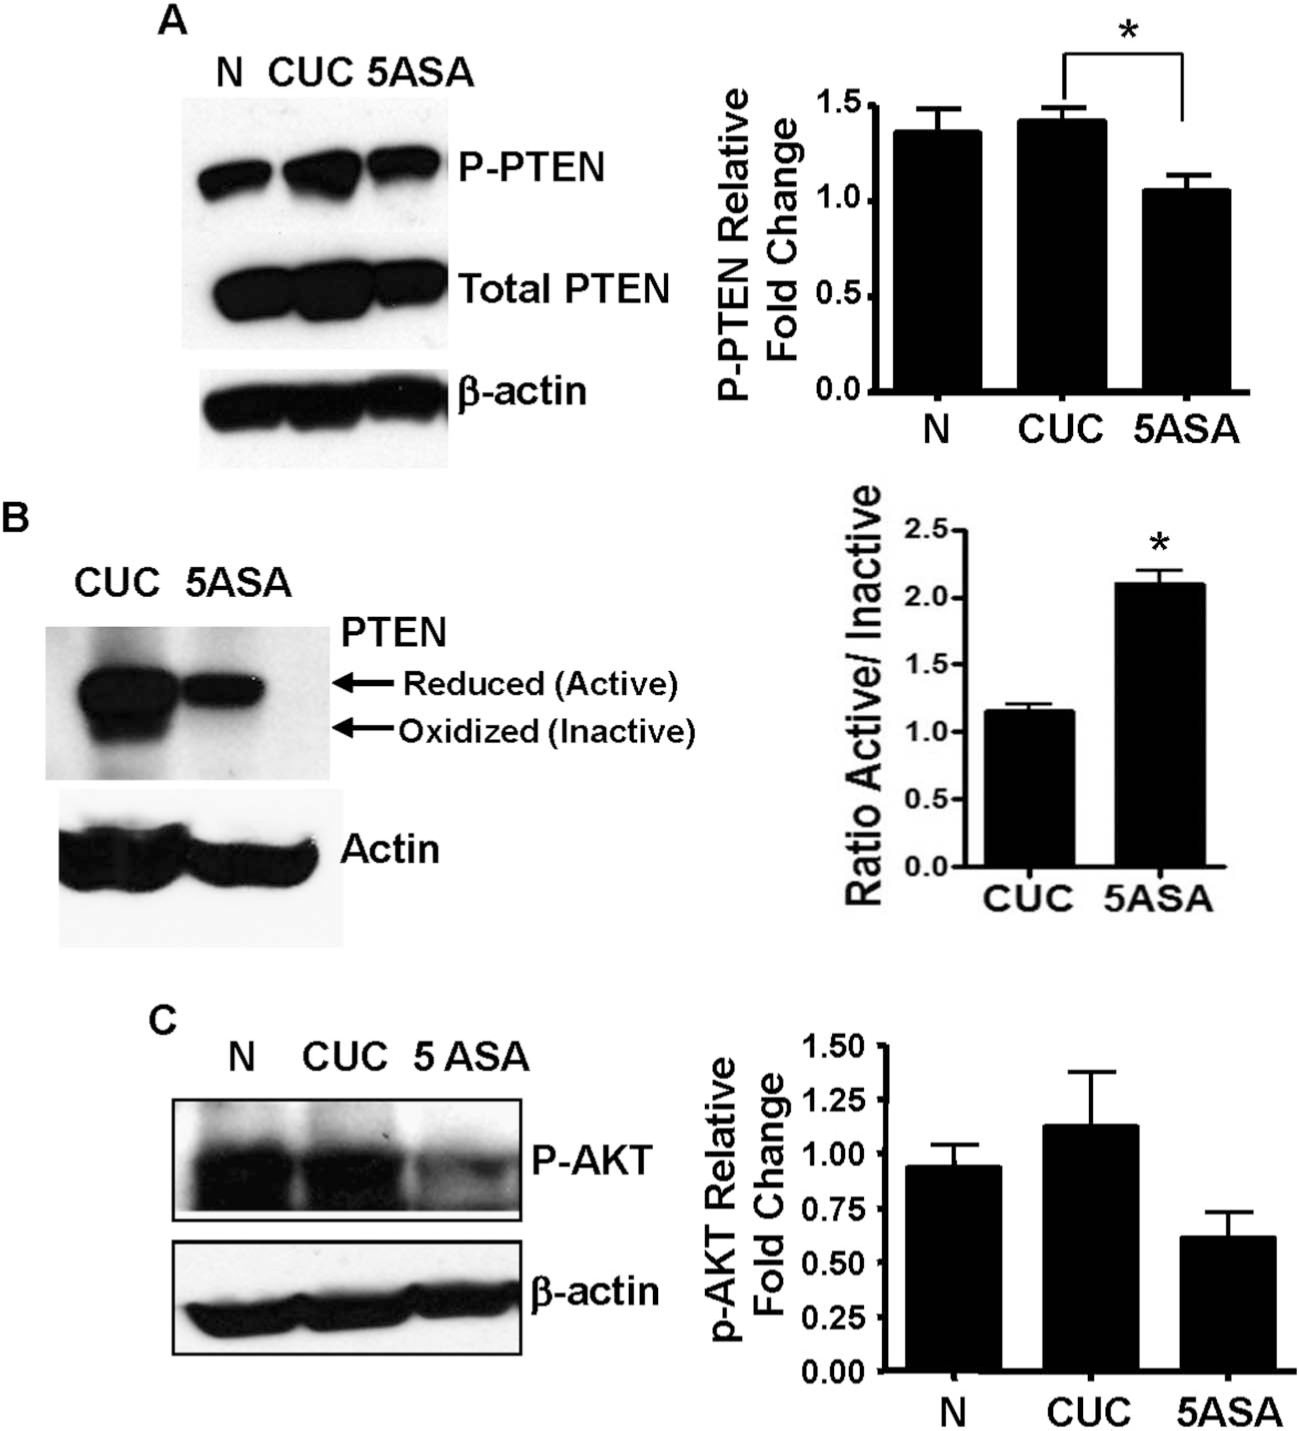
5-ASA–treated patients display reduced levels of PTEN inactivation. A, Protein extracts from N, CUC, and 5-ASA–treated human biopsy specimens were analyzed by WB for total and phosphorylated (inactivated) PTEN. Relative fold changes and statistical significance (*) were determined by densitometry from 6 patients per group relative to total actin. B, The oxidative status of PTEN was analyzed under nonreducing conditions by electrophoresis of lysates from CUC and 5-ASA–treated patients followed by WB. The bar graph (right) indicates mean ratios of active (reduced)/inactive (oxidized) PTEN in untreated CUC and 5-ASA–treated CUC. C, Akt activation was assessed by WB for P-Akt and densitometry of results from 7 patients per group relative to total actin. Actin serves as a loading control for all experiments. WB, Western blot. * indicate statistical significance.