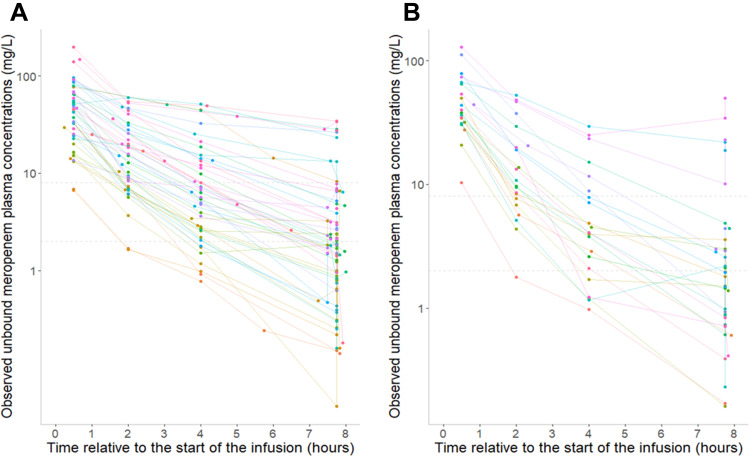
Figure 1.
Observed unbound meropenem plasma concentrations (mg/L) vs time relative to the start of the infusion (hours). Panel (A) represents the early sampling days, panel (B) represents the late sampling days. The dashed lines represent the 2 mg/L and 8 mg/L PK/PD target. The lines connect different observations within the same patient.

