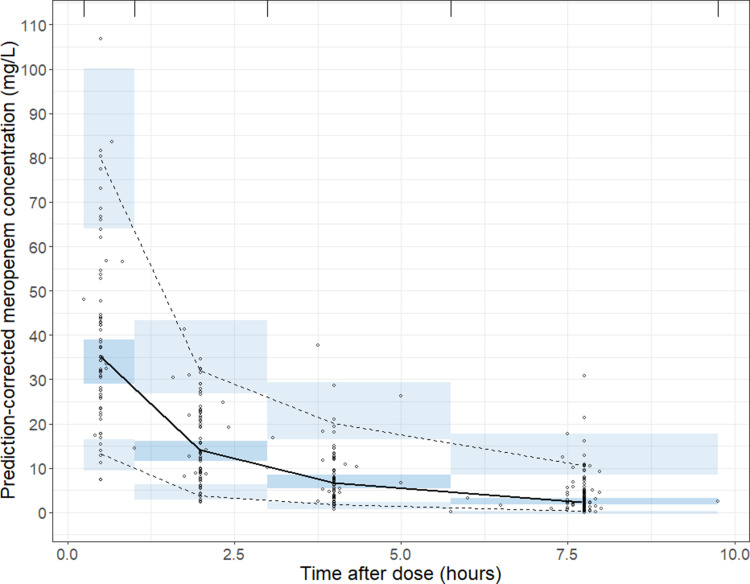
Figure 2.
Prediction-corrected visual predictive check of the final model. The observed prediction-corrected meropenem concentrations are represented by circles. The black solid and dashed lines represent median and 2.5th and 97.5th percentile of the prediction-corrected observations, respectively. The shaded areas indicate 95% prediction-intervals of the median and 2.5th and 97.5th percentile of the simulated values.

