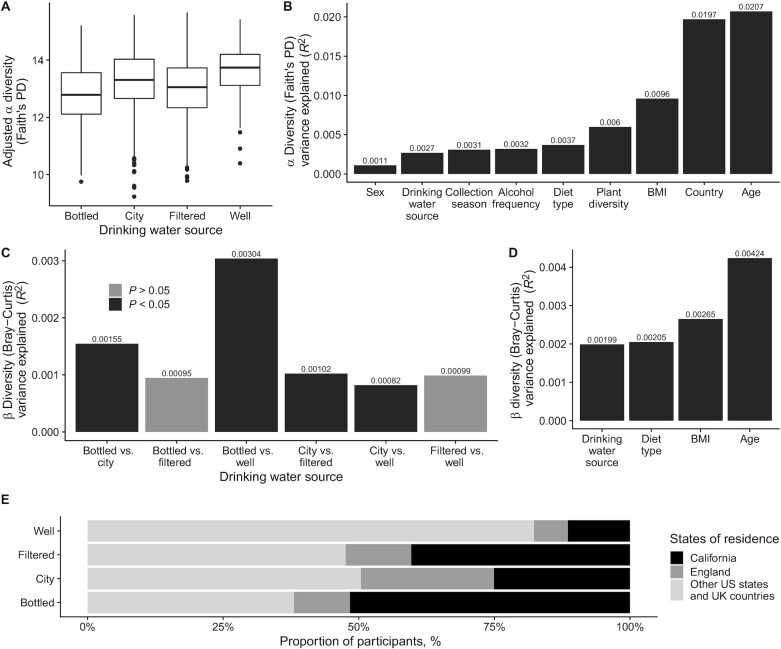
FIGURE 3.
Diversity analysis of fecal microbiota in American Gut Project participants according to their drinking water source (n = 3413). (A) α Diversity measured by Faith's PD (type II ANOVA, P < 0.05). Data are presented as adjusted means and 95% CIs. Adjusted for age, sex, BMI, infant feeding, level of education, country, collection season, exercise frequency, diet type, plant diversity (number of types of plants consumed per week), alcohol, and sugar-sweetened beverage consumption. Groups are bottled (n = 284), city (n = 1784), filtered (n = 1147), and well (n = 198). (B) Faith's PD effect sizes. Proportions of variance captured by significant variables in fully adjusted models. (C) β Diversity measured by Bray–Curtis dissimilarity. Proportions of variance captured by pairwise comparisons of drinking water source groups; adjusted for age, BMI, and diet type. (D) Bray–Curtis dissimilarity effect sizes. (E) State or country of residence of participants according to their drinking water source. Faith's PD, Faith's phylogenetic diversity.

