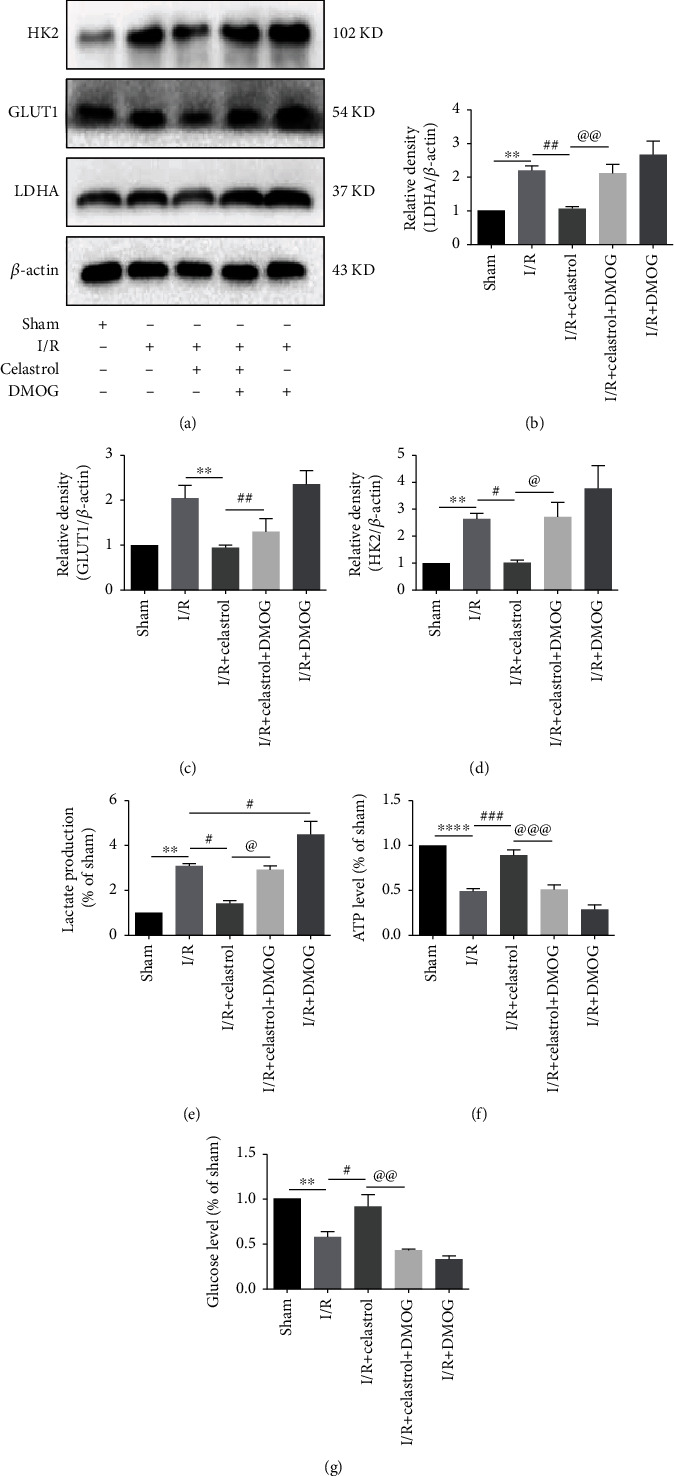
Figure 6.

DMOG blocked celastrol-induced suppression of glycolysis. The protein expression of glycolysis-related factors including LDHA (a, b), GLUT1 (a, c), and HK2 (a, d) in ipsilateral cortex were detected (n = 5). Qualification analysis of lactate production (e), ATP level (f), and glucose content (g) in different groups (n = 5). The data are presented as mean ± SEM. ∗∗P < 0.01 and ∗∗∗∗P < 0.0001 compared with the sham group; #P < 0.05, ##P < 0.01, and ###P < 0.001 compared with the I/R group; @P < 0.05, @@P < 0.01, and @@@P < 0.001 compared with I/R + Celastrol group.
