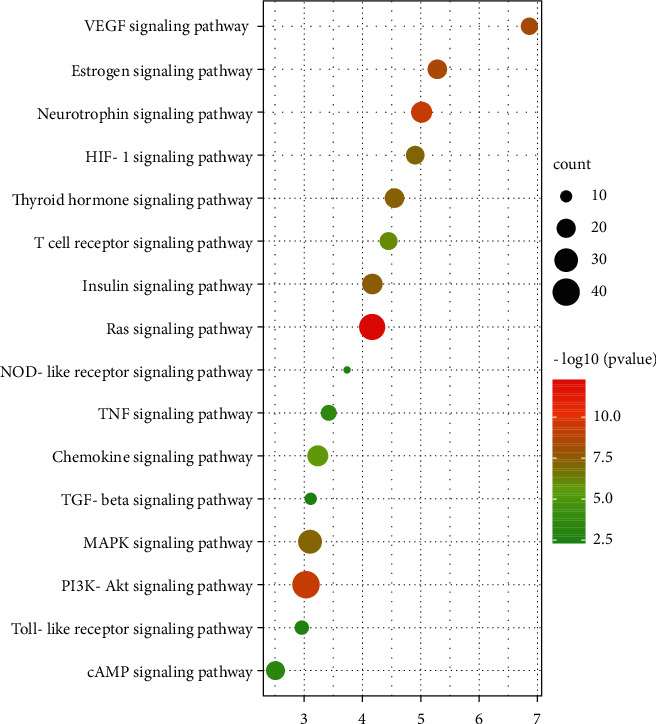
Figure 8.

KEGG signaling pathway enrichment of screened genes. The bar chart showed the 16 pathways related to stroke. “Rich factor” represents the ratio of the number of target genes belonging to a pathway and the number of the annotated genes located in the pathway. A higher rich factor represents a higher level of enrichment. The size of the dot indicates the number of target genes in the pathway, and the color of the dot reflects the different P values.
