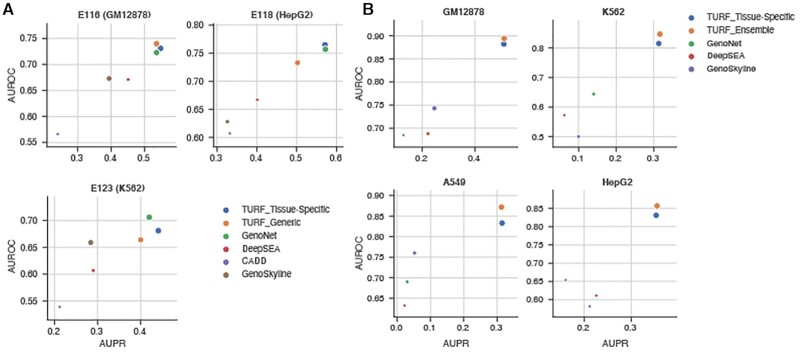
Figure 3.
Tissue-specific predictions performance comparisons. Each plot shows the AUPR (area under the precision recall curve) on x axis and the AUROC (area under the receiver operating characteristics curve) on y axis. The size of each point represents the pearson correlation. (A) Performance on MPRA data in three cell lines (GM12878: 693 positive variants, 2772 control variants; HepG2: 524 positive variants, 1439 control variants; K562: 339 positive variants, 1361 control variants). (B) Performance on allele specific transcription factor binding SNVs (see the number of variants in Supplemental Table S1).

