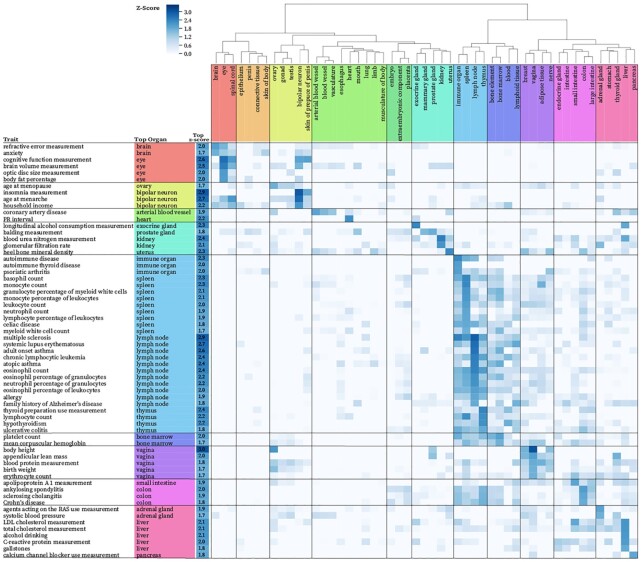
Figure 6.
Enrichment of regulatory variants with high organ-specific scores over variants associated with diverse traits. The z-scores of organs (column) for a given trait (row) are shown. The organ with the highest z-score for each trait is shown in additional columns on left. Only organ-trait pairs with z-scores higher than 0 and passing multiple test correction (FDR threshold of 5%) are shown. Traits with top z-scores <1.7 were ignored in this plot, see complete plot Supplemental Figure S5.

