Figure 2.
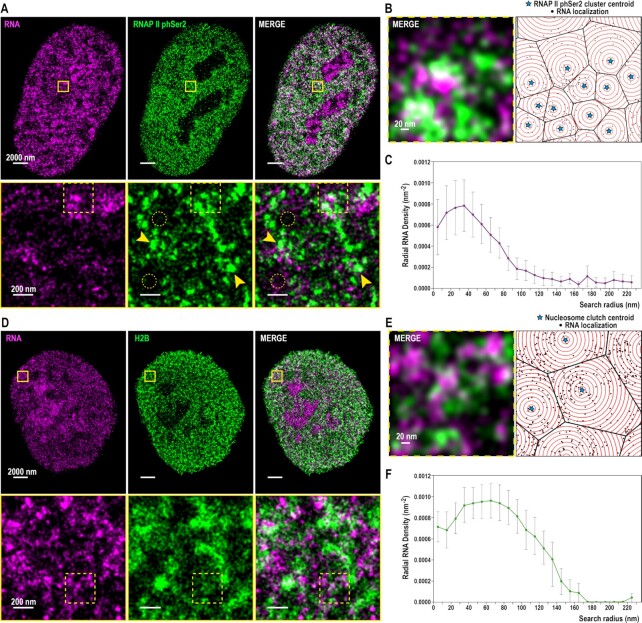
RNAP II phSer2 clusters and nascent RNA associate at small distance. RNA is associated to nucleosome clutches and falls inside the ‘Clutch-DNA’ radius. (A) (Top) Cropped nuclear super-resolution image in hFibs of 20 min EU labelled RNA (magenta) and PAINT image of immunolabelled RNAP II phSer 2 (green) and their merge. (Bottom) Zoom of the region inside the yellow box is shown. Yellow arrows indicate representative examples of local enrichment (clusters) of RNAP II phSer2 signal. Dotted yellow circles indicate representative examples of areas depleted of RNAP II phSer2 signal. (B) (Left) Zoom of the region inside the dotted yellow box in (A, bottom). (Right) Scheme of the analysis of RNAP II phSer2-associated RNA. The centers of RNAP II phSer2 clusters (stars) are the seeds for the Voronoi polygons (black lines) inside which the RNA localizations (black dots) are distributed. Overlaid on top are concentric circles (red) whose radii increase by 10 nm steps. (C) RNA density as a function of the distance from the center of the RNAP II phSer2 cluster (N = 12) The density is measured inside rings of increasing search radii. The dots correspond to the mean, the bars correspond to the standard deviations. (D) (Top) Cropped nuclear super-resolution image in hFibs of 20 min EU labelled RNA (magenta) and DNA-PAINT image of immunolabelled H2B (green) and their overlay. (Bottom) Zoom of the region inside the yellow box is shown. (E) (Left) Zoom of the region inside the dotted yellow box in (D, bottom). (Right) Scheme of the analysis of H2B-associated RNA. The centers of the nucleosome clutches (stars) are the seeds for the Voronoi polygons (black lines) inside which the RNA localizations (black dots) are distributed. Overlaid on top are concentric circles (red) whose radii increase by 10 nm steps. (F) RNA density as a function of the distance from the center of the clutch (N = 6). The density is measured inside rings of increasing search radii. The dots correspond to the mean, the bars correspond to the standard deviations.

