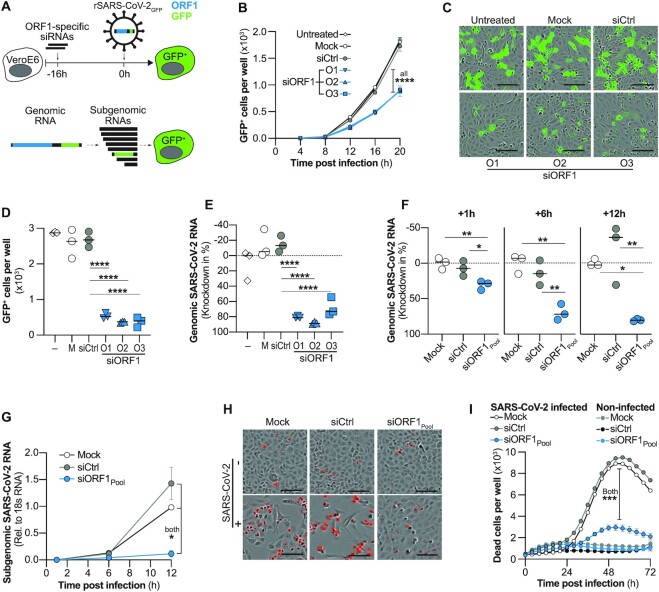
Figure 1.
Effect of targeting genomic SARS-CoV-2 RNA with siRNAs on viral replication and cytopathy. (A, top) Experimental setup used in (B–D). VeroE6 cells were transfected with siRNAs targeting ORF1 (siORF1) 16h before infection with recombinant, GFP-expressing SARS-CoV-2 (rSARS-CoV-2-GFP; MOI 1) and number of GFP+ positive cells quantified. Cells receiving no treatment (untreated), transfection reagent only (Mock) or a control siRNA (siCtrl) served as controls. (A, bottom) Schematic representation of gRNA, as well as sgRNAs. Note that ORF1 (blue) is only part of full-length gRNA but not sgRNAs. GFP, green fluorescent protein. (B) Kinetic of viral spread showing number of GFP+ cells determined by automated quantification using the integrated Incucyte S3 software. (C, D) GFP expression 24h after infection with rSARS-CoV-2-GFP. (C) Exemplary fluorescence microscopy pictures. Bar at lower right indicates 0.1 mm length and (D) quantification of GFP+ cells. (E) Same experimental setup as in (B–D) but cells were infected with wildtype SARS-CoV-2 (MOI 0.1) and lysed after 24 h to quantify genomic SARS-CoV-2 RNA from cell lysate by RT-qPCR. (F, G) siRNAs used in (B–E) were pooled and transfected into VeroE6 cells 6h before infection with wildtype SARS-CoV-2. Cells were lysed at different time points after infection and SARS-CoV-2 (F) gRNA as well as (G) sgRNAs quantified by RT-qPCR. (H, I) VeroE6 cells were transfected with siRNAs 6h before infection with wildtype SARS-CoV-2 (MOI 1) and dead cells visualized using the Incucyte® Cytotox Red Dye and quantified using the Incucyte S3. (H) Exemplary fluorescent microscopy pictures taken at 56h p.i. Dead cells are shown in red. Bar at lower right indicates 100 μm length. (I) Time kinetic of dead cells quantified every 4h over a period of 3 days. (B, G, I) Mean of triplicates for each treatment group is shown, error bars indicate SEM. Bars in (D–F) show median. Statistical differences were calculated using (B, G, I) repeated measures one-way Anova or (D–F) regular one-way Anova with Dunnett′s multiple comparison correction. M, Mock; –, untreated; O1-3, ORF1-specific siRNAs 1–3; *P < 0.05; **P < 0.01; ***P < 0.001; ****P < 0.0001.

