Figure 3.

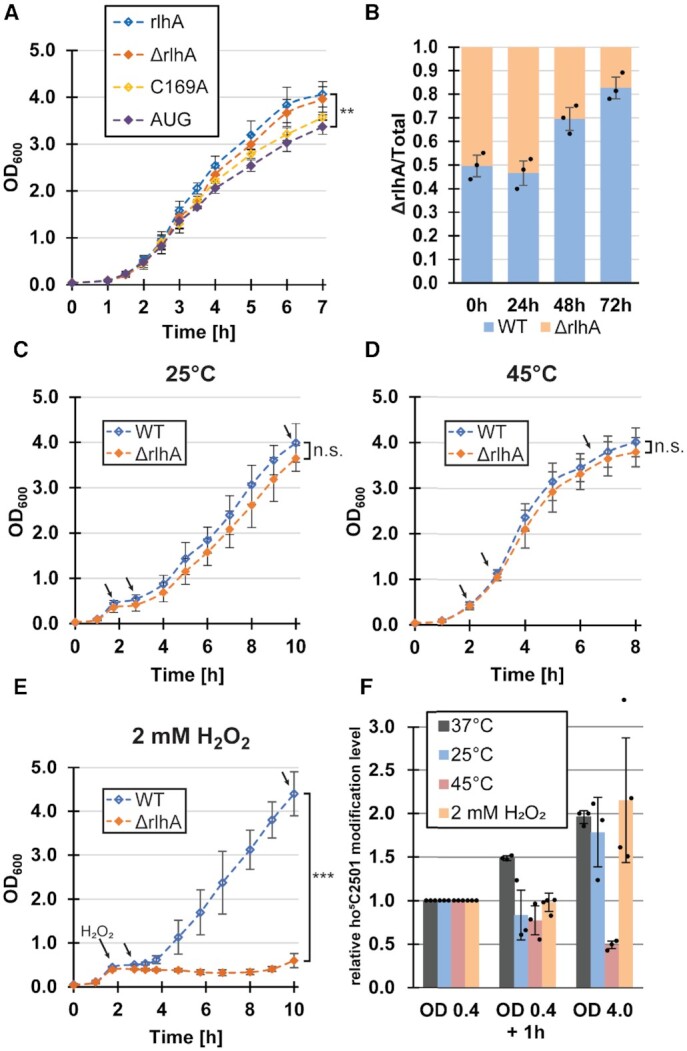
Cell growth and ho5C2501 modification levels under different stress conditions. (A) Average growth curves of the knockout cell line transformed with either an empty vector (ΔrlhA), the wildtype rlhA gene (rlhA), an inactive rlhA mutant (C169A), or the start codon mutated rlhA gene (AUG). All strains were incubated in LB medium at 37°C. Error bars indicate standard deviations (n = 3–6) and the significance was calculated for the last time point using paired Student's t-test (P = 0.008). (B) Average proportion of ΔrlhA cells grown in competition with wildtype cells (WT) after repeated 24 h incubation at 37°C, starting with an initial 1:1 mixture of both strains (0 h). The ratio of ΔrlhA cells was determined by comparison of cells growing on chloramphenicol plates (total) to cells growing on kanamycin selective plates (ΔrlhA). (C) Average growth curves of WT and ΔrlhA cell lines that were cold shocked and temperature shifted to 25°C after OD600 reached a value of 0.4 (∼2 h of incubation at 37°C). Error bars indicate standard deviation of n = 3 (n.s.; statistically not significant). Black arrows indicate time points when samples were taken for ho5C2501 level analysis by CMCT treatment and reverse transcription. (D) Same as in (C), but a heat shock was applied and the temperature was shifted to 45°C (n = 3). (E) Same as in (C), but H2O2 was added to a final concentration of 2 mM after OD600 reached a value of 0.4 and growth was continuously monitored at 37°C. Error bars indicate standard deviations (n = 4) and the significance was calculated using Student's t-test (***P < 0.005). In panels (C)–(E) black arrows indicate time points of sample removal for subsequent CMCT analyses to assess ho5C2501 levels. (F) Quantification of ho5C2501 levels in WT cells at the marked time points in panels (C)-(E) by reverse transcription of hydrolyzed CMCT-treated total RNA. ho5C2501 signal intensities of samples taken after 1 h of stress treatment (OD 0.4 + 1 h) and in stationary phase cultures (OD 4.0) were compared relative to the ho5C2501 signal intensities of samples taken after ∼2 h of incubation under unstressed conditions (OD 0.4). Additionally, ho5C2501 levels were analyzed in WT cells under optimal conditions without the addition of any stressor (37°C). The average relative signal intensity is displayed. Error bars indicate standard deviation of n = 3–4.
