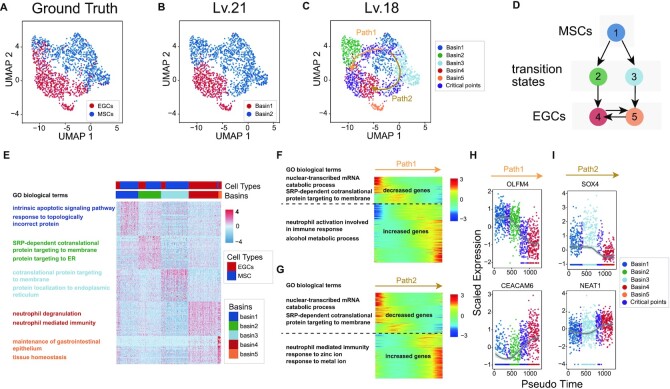
Figure 4.
MarkovHC detected critical points from MSCs to gastric cancer cells. (A) 831 mesenchymal stem cells (MSCs) and 695 MSC-origin early gastric cancer cells (EGCs) (67) were projected into 2-dimensional space by UMAP. (B) MarkovHC found two basins on Lv.21. (C) Five basins were clustered and two transition paths from MSCs to EGCs were inferred by MarkovHC. Purple points indicate critical points on the transition paths. (D) The inferred transitions among basins in (C). (E) The heatmap and enriched GO terms of the top 50 DEGs per basin in (C). (F, G) DEGs along Path1 and Path2 in (C). (H-I) OLFM4 and CEACAM6 showed opposite ‘gene-flow’ trends along Path1 (H). SOX4 and NEAT1 showed opposite ‘gene-flow’ trends along Path2 (I). The expression values of these genes dramatically changed around the critical points.

