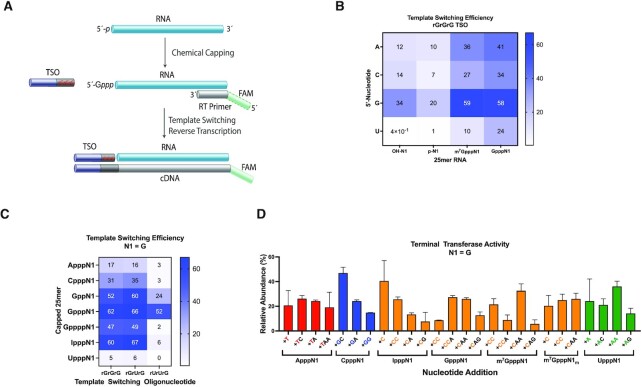
Figure 2.
The effect of the cap structure on template switching and terminal transferase activities. (A) Schematic of cDNA synthesis through chemical capping of a monophosphate RNA template followed by template-switching reverse transcription. An unmethylated guanosine cap is shown. Red shades in the template switching oligonucleotide (TSO) represent variable 3′ end nucleotides. Green shades in the DNA RT primer represent either a fluorescent label (CE assays) or a P7 sequence index (sequencing assays). (B) Heat map showing how the template switching efficiency is affected by the first nucleotide of the RNA template and 5′ end capping. Color gradient indicates percentage of template switching products as determined by CE analysis. (C) Heat map of the template switching efficiency for various non-native RNA caps in the presence of three different TSOs. (D) Nontemplated deoxynucleotide addition profile in absence of a TSO as determined by mass spectrometry analysis. Only the most abundant nontemplated additions (represented in successive order of incorporation to the 3′ end of the cDNA) are shown. Data represent mean ± SD of n = 2 independent experiments. All assays were performed with discrete synthetic 25mer RNAs.

