Figure 4.
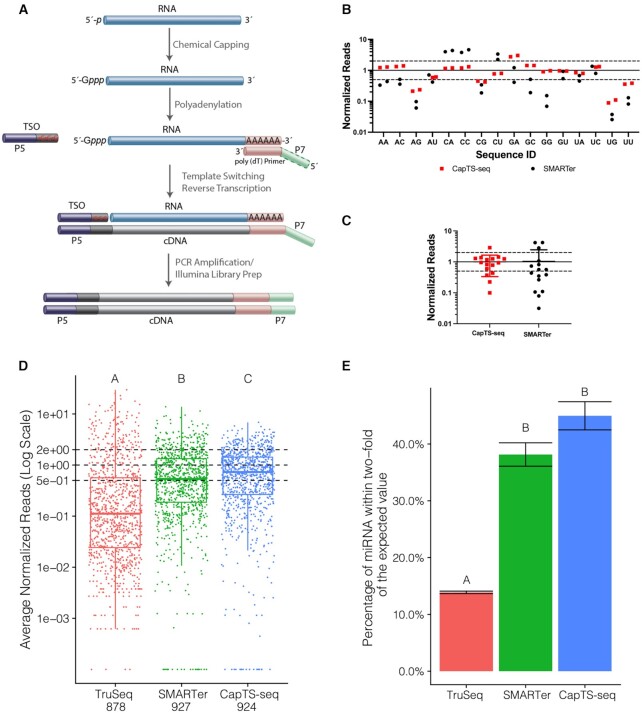
CapTS-seq improves small RNA sequence coverage representation. (A) Schematic of CapTS-seq library preparation workflow using a poly(dT) primer for reverse transcription. (B) Normalized sequencing reads of CapTS-seq and SMARTer libraries generated from a pool of 16 discrete RNA templates (25mers) varying the first two nucleotides N1 and N2. (C) Box plot depicting read average of two technical replicates for each sequence represented in (B). Reads were normalized to 1 (solid line) and the interval of 2-fold above and below this boundary was denoted by dashed lines. (D) Normalized read counts of TruSeq, SMARTer and CapTS-seq libraries prepared from an equimolar mix of 962 synthetic miRNAs (miRXplore reference). Each miRNA is expected to have a normalized read value of 1 (central dashed line). The upper and lower dashed lines correspond to the interval of 2-fold above and below the expected value. (E) Percentage of miRNAs falling within 2-fold of their expected values shown as the average of two technical replicates per method. Error bars represent the standard deviation. Letter codes indicate groups that are significantly different from each other with Tukey corrected P < 0.01.

