Figure 2.
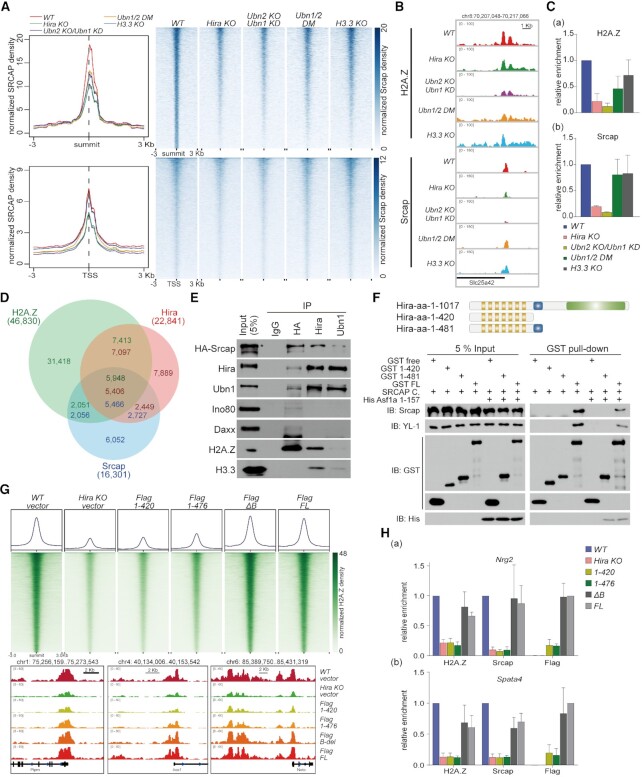
HIRA collaborates with SRCAP to deposit H2A.Z on genome. (A) Meta-analysis (left) and heatmap (right) show Srcap reads density around summit (upper) and TSS (below) within a ±3 kb window. (B) Representative loci on Slc25a42 gene show the enrichment of H2A.Z and Srcap. (C) ChIP-qPCR validation of H2A.Z and Srcap enrichment at promoter of Slc35a42 gene. Error bars represent data from three independent experiments. (D) Venn diagram shows the overlap between H2A.Z, Hira and Srcap peaks. (E) Western blot shows the interaction among endogenous HA-Srcap, Hira and Ubn1 from nuclear lysates. Ino80, Daxx, H2A.Z and H3.3 are also detected. (F) Top panel showed schematic presentation of full length and truncation mutants of Hira subunit. Bottom panel showed the biochemical interactions between Hira truncations and SRCAP complex are analyzed by GST pull-down coupled with western blot analyses. (G) Heatmaps (upper) show H2A.Z reads density around H2A.Z peak summits (upper) in R1 WT, Hira-KO and Hira-truncation mutant expressing cells within a ±3 kb window. Representative loci (bottom) show the enrichment of H2A.Z. (H) ChIP-qPCR of H2A.Z, Srcap and Flag at representative genes Nrg2 and Spata4 in the rescued overexpressed cell lines. Error bars represent data from three independent experiments.

