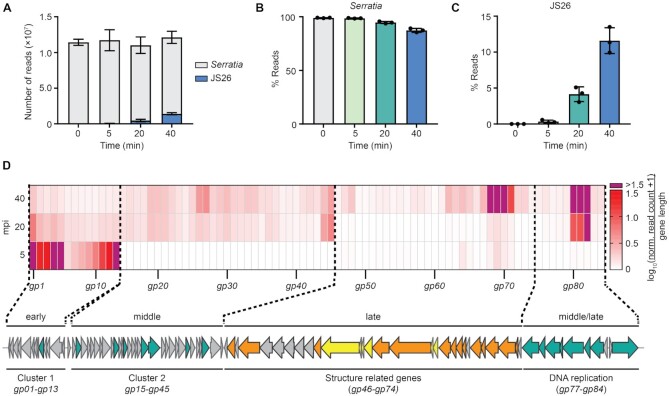
Figure 2.
JS26 temporal gene expression profile. (A) Total number of reads mapping to Serratia (light grey) and phage JS26 (blue). Percentage (%) of reads mapping to (B) Serratia and (C) JS26 throughout infection. In (A–C), data are represented as the mean of biological triplicates ± SD. (D) Temporal analysis of phage gene expression. Changes in gene expression were represented as the mean of the normalized read counts of each timepoint against the uninfected control (DESeq2 normalization) divided by gene length (bp) and shown as log10(x + 1). Values for highly expressed genes that were above the defined range are indicated in purple. gp14 was omitted from the diagram as no reads mapped to this predicted gene. For raw read density across phage genome see Supplementary Figure S1A–D.

