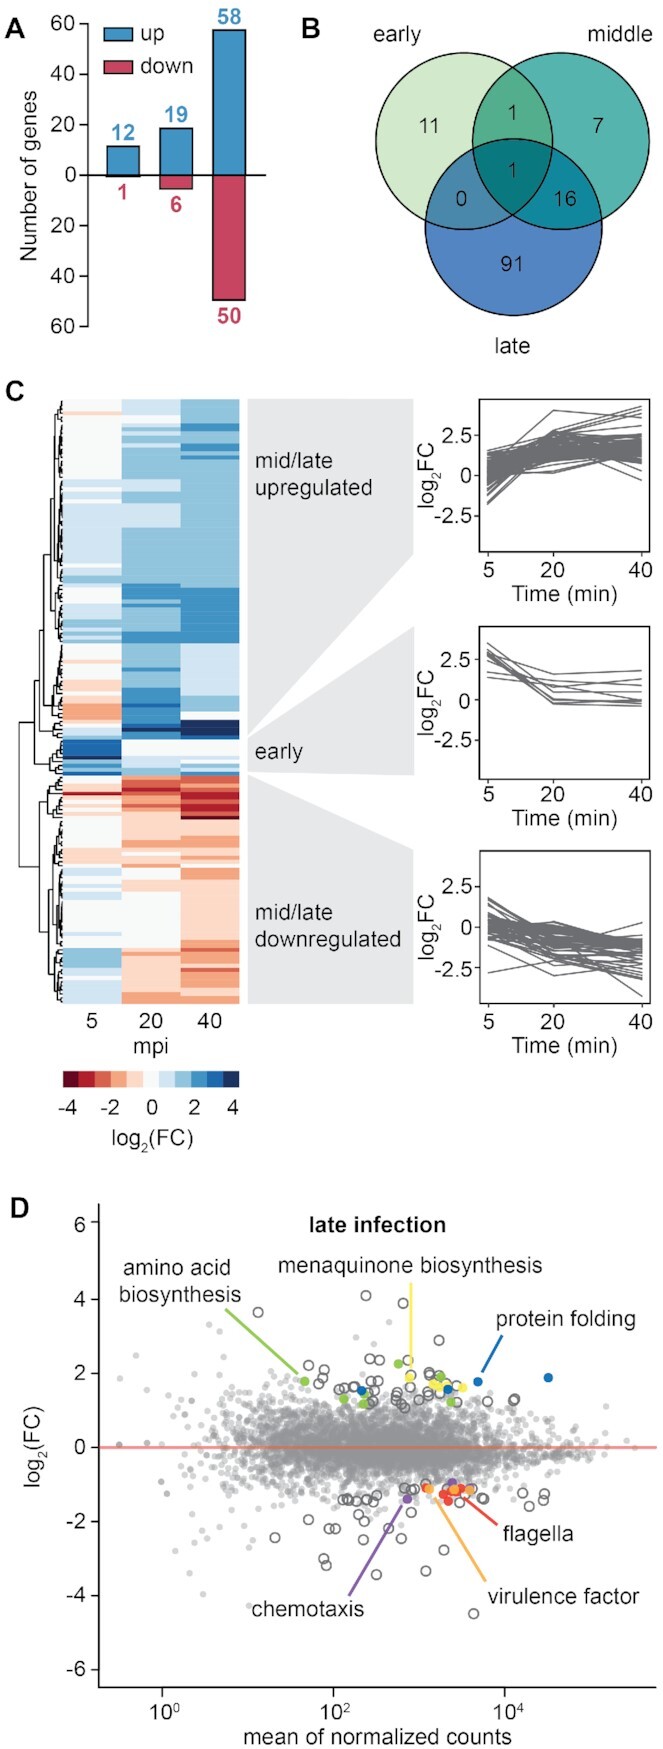
Figure 3.

The host response is mostly altered at late stages of infection. (A) Number of genes significantly up (blue) and down (red) regulated in Serratia throughout infection. (B) Venn diagram of genes significantly differentially expressed during early (5 mpi), mid (20 mpi) and late (40 mpi) infection. (C) Heat map of host genes significantly differentially expressed in early, middle or late infection. (D) Expression landscape in Serratia during late infection (40 mpi). Genes significantly differentially expressed (log2(FC) > 0.58 and Padj < 0.05) are represented as open or coloured circles depending their function. Serratia genes differentially expressed during JS26 infection are listed in Supplementary Table S7.
