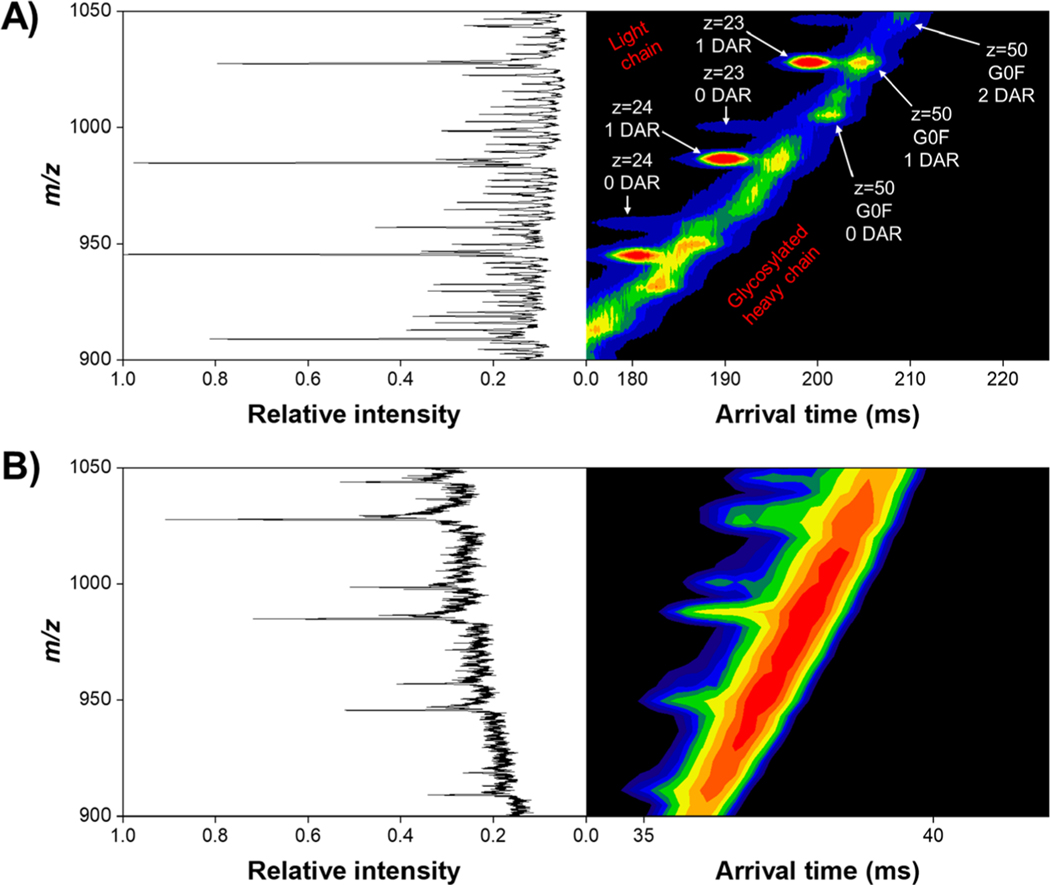
Figure 2.
2D IMS-MS plot of the reduced antibody–drug conjugate after a 4.5 m SLIM IMS separation (A) and 1 m DTIMS separation (B). The light chain exhibits an overall lower charge state distribution compared to its heavy chain counterpart, as evidenced by less closely spaced IMS-MS peaks. Arrows illustrate selected m/z regions for both the heavy and light chains, where annotated mass spectra are shown in Figure 3. We attribute the “noisier” background in DTIMS to be from lower, overall, signal intensity compared to SLIM IMS.

