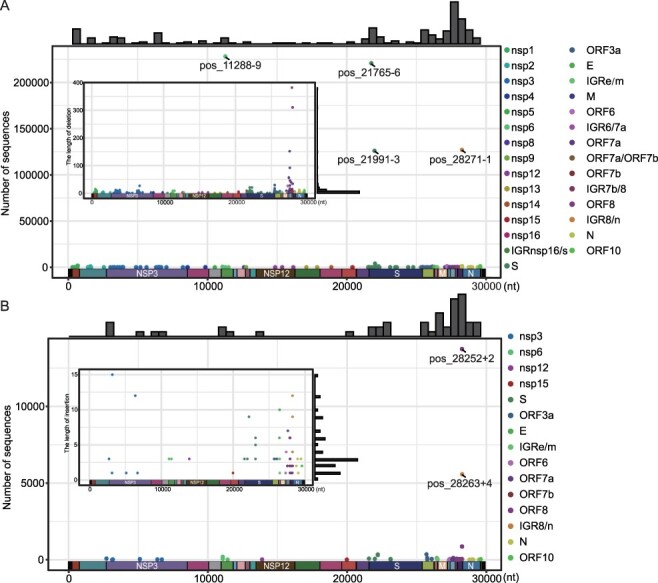
Figure 2.

The distribution of indels on SARS-CoV-2 genome. The sequence number (outer plot) and length (inner plot) of deletion (A) and insertion (B) types were described. The histograms above the outer plots show the frequencies of indel types along the entire genome. The deletion types associated with each gene is marked with different colors.
