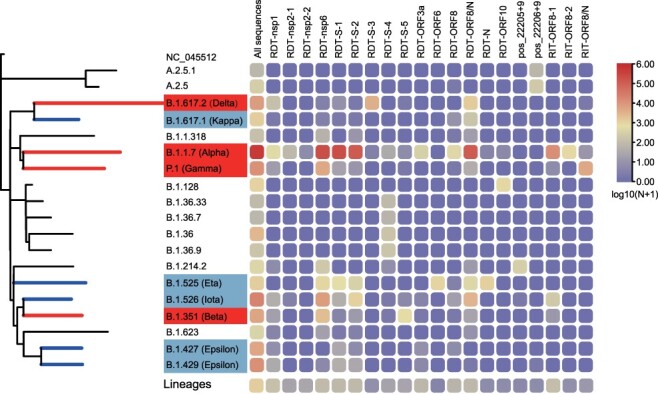
Figure 4.

Distribution of RDT and RIT in Pango lineage. The phylogenetic tree is constructed using the nextstrain augur pipeline and based on a set of reference sequences downloaded from GISAID. For the definition of variants of concern (red) and variants of interest (CornflowerBlue), please refer to the official website of WHO (https://www.who.int/en/activities/tracking-SARS-CoV-2-variants/). The number of RDTs and RITs shown in the heatmap are transformed using (log(N + 1)).
