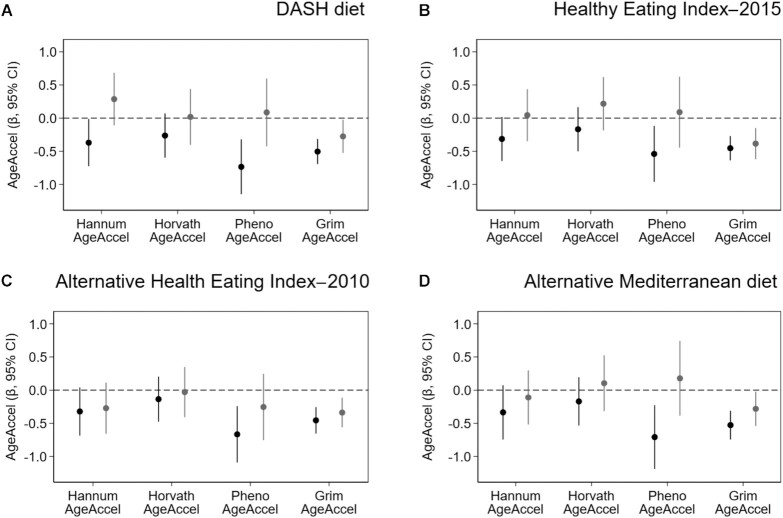
FIGURE 3.
Associations between recommendation-based diets and the 4 measures of epigenetic age acceleration, stratified by physical activity level. Plots display the β-coefficients and 95% CIs from adjusted linear regression models, which represent the adjusted mean difference for the 4 individual AgeAccel metrics per 1-SD increase in diet quality, for the (A) DASH diet, (B) Healthy Eating Index–2015, (C) Alternative Health Eating Index–2010, and (D) Alternative Mediterranean diet among women who did not meet physical activity guidelines (<2.5 h/wk, black lines; n = 1541) and for women who did (≥2.5 h/wk, gray lines; n = 1153). Significant statistical interactions determined by cross-product terms were observed for physical activity on the relationships between PhenoAgeAccel and the DASH diet (P-interaction = 0.04) and the aMed diet (P-interaction = 0.04). Abbreviation: DASH, Dietary Approaches to Stop Hypertension.

