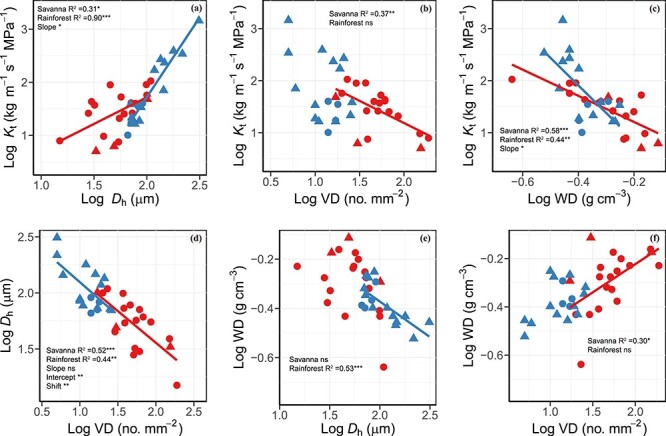
Figure 2.

Log–log bivariate relationships between (a) theoretical hydraulic conductivity (Kt) and hydraulically weighted vessel diameter (dh), (b) Kt and VD, (c) Kt and WD, (d) dh and VD, (e) WD and dh and (f) WD and VD across liana species from savanna (red symbols and regression line; n = 19) and tropical seasonal rainforest (blue symbols and regression line; n = 17). Circle denotes deciduous lianas and triangle denotes evergreen lianas. Regression lines were given when bivariate correlations were significant. Only when significant log–log bivariate relationships in two habitats were existent, the tests of the SMA regression slope, intercept and shift along the common slopes were conducted (see Table S4 available as Supplementary data at Tree Physiology Online). ns, P > 0.05; *P < 0.05; **P < 0.01; ***P < 0.001.
