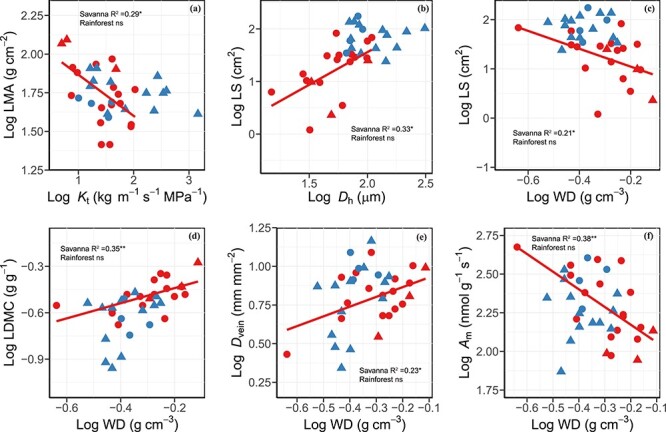
Figure 4.

Log–log bivariate relationships between (a) LMA and theoretical hydraulic conductivity (Kt), (b) LS and hydraulically weighted vessel diameter (Dh), (c) LS and WD, (d) LDMC and WD, (e) vein density (Dvein) and WD and (f) mass-based light-saturated photosynthetic rate (Am) and WD across liana species from savanna (red symbols and regression line; n = 19) and tropical seasonal rainforest (blue symbols and regression line; n = 17). Circle denotes deciduous lianas and triangle denotes evergreen lianas. Regression lines were given when bivariate correlations were significant. ns, P > 0.05; *P < 0.05; **P < 0.01.
