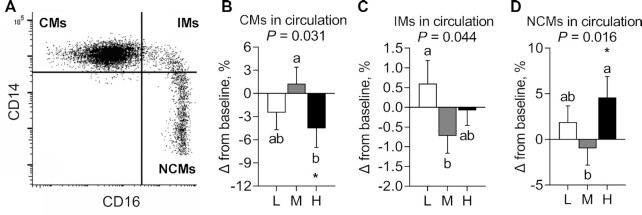
FIGURE 4.
Change in the percentage of monocyte subsets after consuming L, M, and H for 4 wk in fasted adults at risk of cardiometabolic disease. (A) Representative dot plot of CD14 and CD16 expression and the gate of monocyte subsets. (B–D) Change in the percentages of (B) CMs, (C) IMs, and (D) NCMs after spice consumption. Labeled means without a common letter differ, P < 0.05. *Significant change from baseline, P < 0.05. Data are mean ± SEM. n = 23. CM, classical monocyte; H, high-dose spice diet; IM, intermediate monocyte; L, low-dose spice diet; M, medium-dose spice diet; NCM, nonclassical monocyte.

