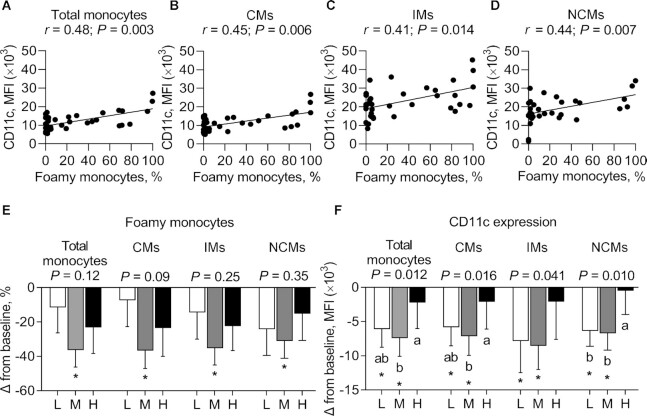
FIGURE 5.
Correlation between the percentage of foamy monocytes and the expression of CD11c on total monocytes (A), CMs (B), IMs (C), and NCMs (D) and change in the percentage of foamy monocytes in monocyte subsets (E) and their surface expression of CD11c (F) after consuming L, M, and H for 4 wk in fasted adults at risk of cardiometabolic disease. Labeled means without a common letter differ, P < 0.05. *Significant change from baseline, P < 0.05. Data are mean ± SEM. n = 12. CM, classical monocyte; H, high-dose spice diet; IM, intermediate monocyte; L, low-dose spice diet; M, medium-dose spice diet; MFI, mean fluorescence intensity; NCM, nonclassical monocyte.

