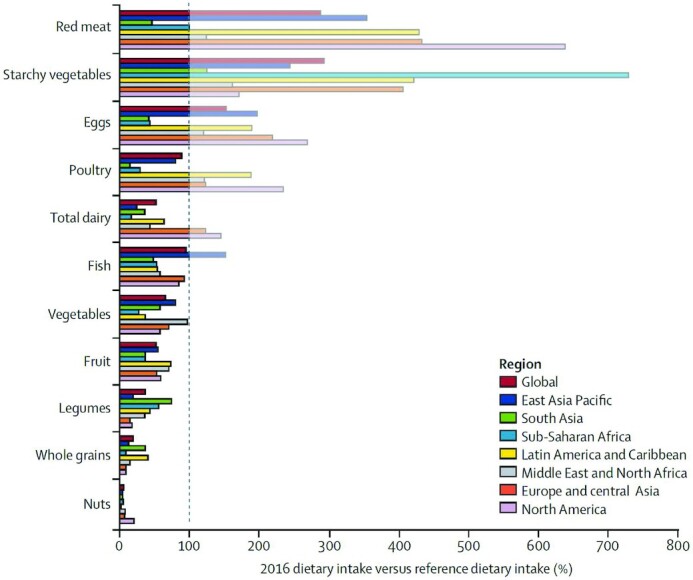
FIGURE 4.

The dietary consumption of food groups regionally as compared to the EAT–Lancet reference diet. The graph shows the gap between global and regional dietary patterns in 2016 and reference diet intakes of food. The dotted line represents reference diet intakes. Data on 2016 intakes are from the Global Burden of Disease database. Source: Willett et al. (1).
