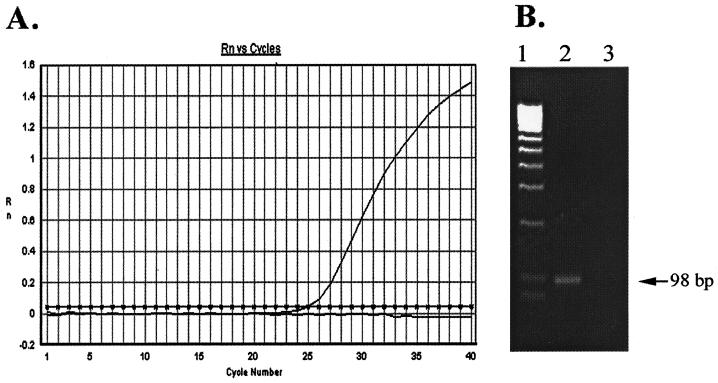
FIG. 2.
Real-time PCR detection of the T. gondii B1 gene. (A) Typical amplification plot with 500 tachyzoites as the initial DNA template. Rn, fluorescent signal. (B) The PCR product from panel A was fractionated on a 2% agarose gel followed by visualization with ethidium bromide staining. Lane 1, DNA molecular weight marker; lane 2, 500 tachyzoites; lane 3, no-template control.

