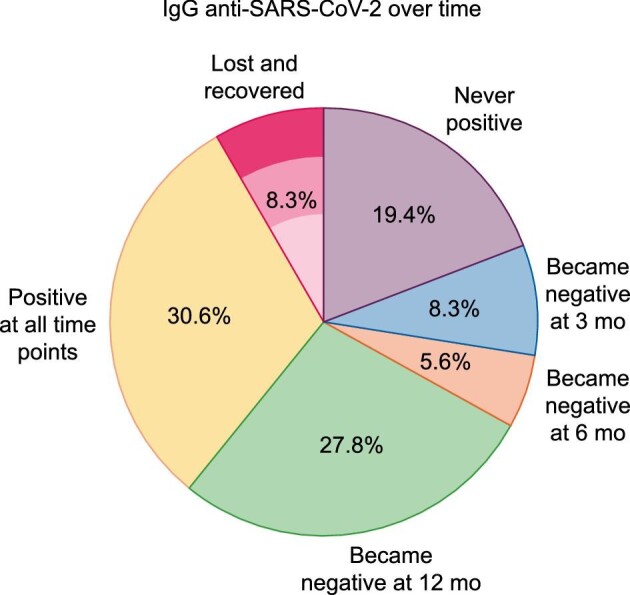
FIGURE 5:

IgG anti-SARS-CoV-2 antibodies over 1 year of follow-up. (A) IgG anti-SARS-CoV-2 antibody trajectories. Y: positive IgG anti-SARS-CoV-2 antibodies; N: negative IgG anti-SARS-CoV-2 antibodies; exitus: patients who had died by this time point. (B) Percentage of patients with the different IgG anti-SARS-CoV-2 antibody trajectories during 1 year of follow-up. Percentage calculated for a total of 36 patients with assessments at all the different time points.
