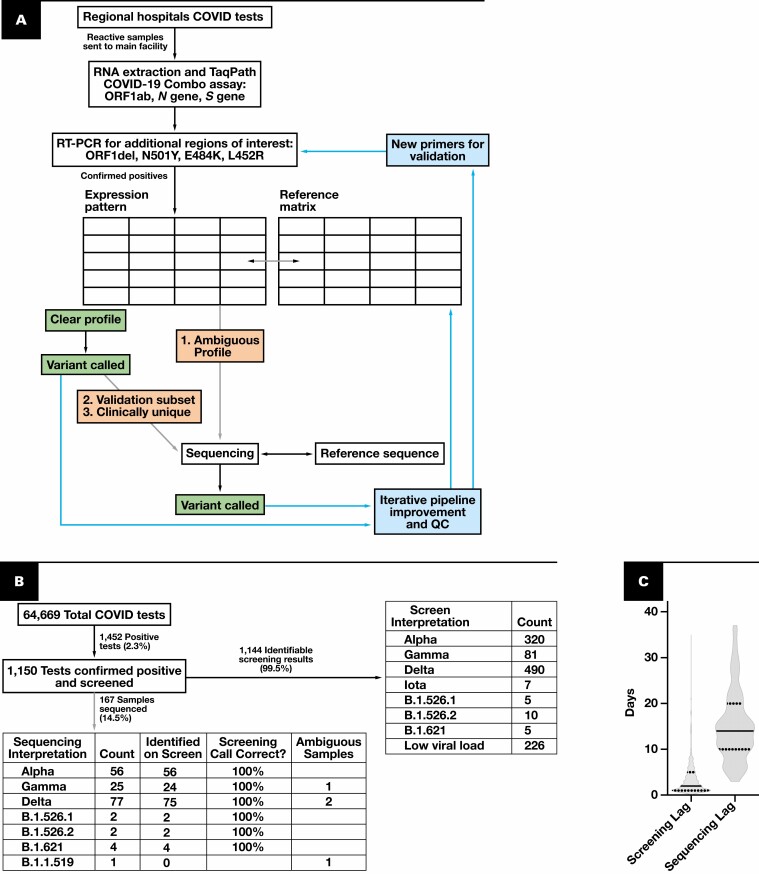
Figure 1.
Schematic and flowchart of the dynamic variant calling pipeline. A, Schematic of the pipeline. Gray arrows indicate optional pathways, with examples of samples chosen for sequencing. Arrows and boxes coming from variant identification boxes show areas for iterative improvement and quality control of the pipeline. Confirmed positives are samples that have an N gene cycle threshold (Ct) of less than 33. B, Flowchart of pipeline throughput over 76 days. Data collected from May 21, 2021, through August 4, 2021. Ambiguous samples refer to those samples that the reverse transcription–polymerase chain reaction (RT-PCR) algorithm cannot classify with the current rule set. C, Elapsed time between collection, screening, and sequencing for all samples analyzed. Solid line indicates the median; quartiles are indicated with dotted lines. COVID-19, coronavirus disease 2019; QC, quality control.

