Figure 2.
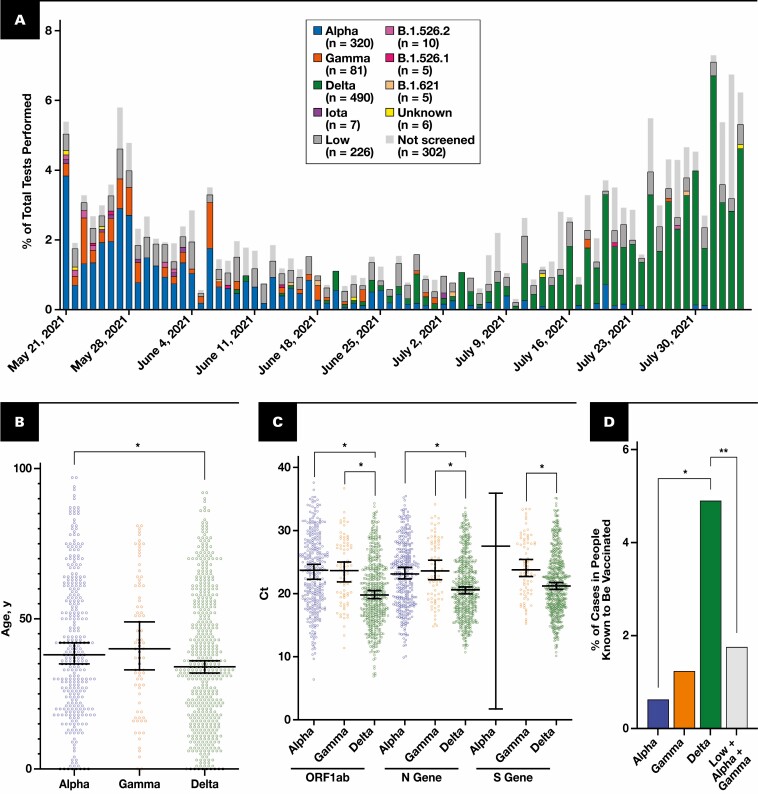
Tracking of variants and characterization of Delta. A, Percentage of each variant per total samples tested per day. Each bar corresponds to 1 day. Variants are color-coded and indicated in the key. The totals indicated in the key are the total count detected via the pipeline over 76 days. “Low” indicates samples with insufficient viral load for screening as measured by a high N gene cycle threshold (Ct) greater than 33. “Not screened” samples were not received at the main facility. B, Each dot indicates one sample, the y-axis is patient’s age, and x-axis is the variant identified. Median and 95% confidence interval are indicated with the bars. Alpha median age was 38.00, n = 320. Delta median age was 34.00, n = 490. *P < .005, Mann-Whitney two-tailed test. C, Variant vs Ct for core markers: ORF1ab, N gene, and S gene. Each dot represents one sample. Median and 95% confidence interval are indicated. *P < .0001, one-way analysis of variance with Tukey multiple comparison correction. D, Percentage of each variant that is in patients known to be vaccinated relative to all patients identified with that variant. *P < .0005, two-tailed Fisher exact test. **P < .005, two-tailed Fisher exact test.

