Figure 3.
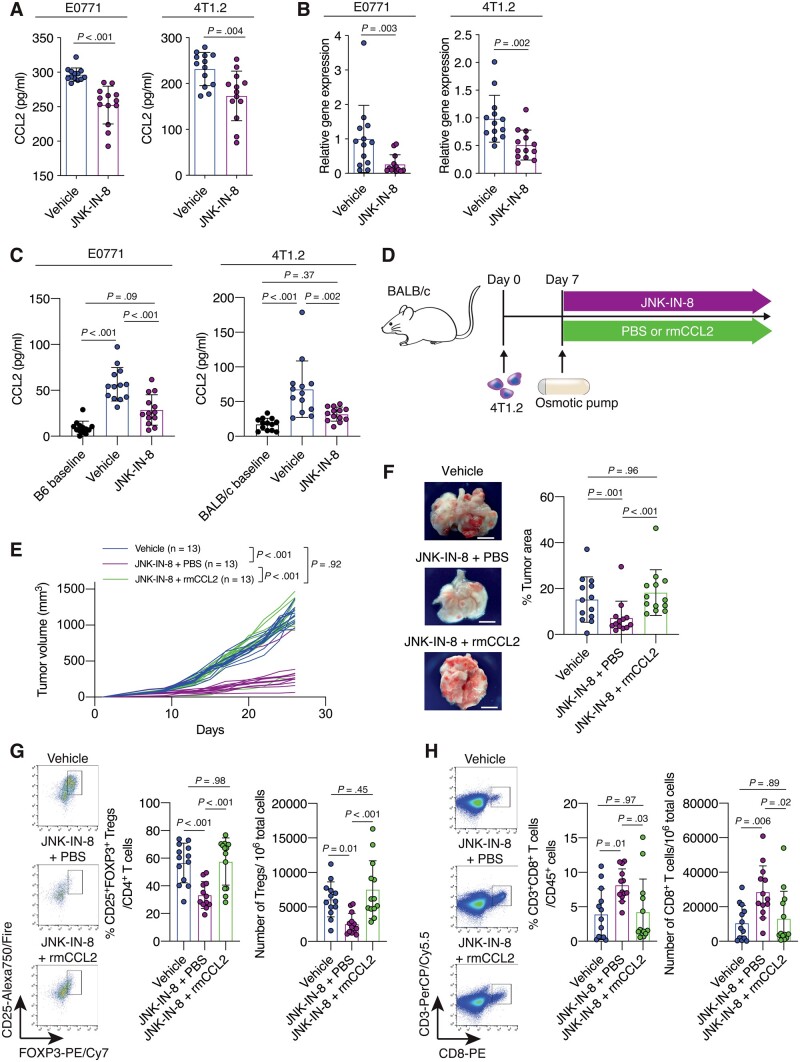
The contributions of C-C motif ligand 2 (CCL2) to C-JUN N-terminal kinase (JNK)-mediated immunosuppressive tumor microenvironment (TME) formation and tumor progression in triple-negative breast cancer (TNBC). A) Quantification of CCL2 concentration in tumors from the vehicle- or JNK-IN-8–treated E0771 (n = 13 per group) and 4T1.2 (n = 13 per group) models. B) Quantification of Ccl2 mRNA expression in tumors from vehicle- or JNK-IN-8-treated E0771 (n = 13 per group) and 4T1.2 (n = 13 per group) models as evaluated by quantitative reverse transcription-–polymerase chain reaction (qRT-PCR). C) Quantification of CCL2 concentration in sera from the vehicle- or JNK-IN-8–treated E0771 (n = 13 per group) and 4T1.2 (n = 13 per group). The CCL2 levels in sera collected before tumor injection are indicated as the B6 baseline for the E0771 model (n = 13) and the BALB/c baseline for the 4T1.2 model (n = 13). D) Schematic showing the experimental design: 4T1.2 cells were injected into BALB/c mice. Seven days after tumor injection, mice were treated with vehicle (not shown) or with JNK-IN-8. JNK-IN-8–treated mice were administered either phosphate-buffered saline (PBS) or recombinant murine CCL2 (rmCCL2) via an osmotic pump implanted in the backs of the mice. E) Tumor growth curves for the vehicle, JNK-IN-8 + PBS, and JNK-IN-8 + rmCCL2 groups (n = 13 per group). F) Gross appearance of the lungs and quantification of the percentage tumor area for the lungs of mice from each group. G and H) Flow cytometry analysis of tumors from each group for (G) regulatory T cells (Tregs) and (H) cluster of differentiation 8 (CD8+) T cells. LIVE/DEAD Aqua– and CD45+ cells were gated. Quantification of (G) the percentage of CD25+ forkhead box p3 (FOXP3+) cells in CD3+CD4+ cells and the number of CD3+CD4+CD25+FOXP3+ cells in 106 tumor cells and (H) the percentage of CD3+CD8+ cells in CD45+ cells and the number of CD3+CD8+ cells in 106 tumor cells is shown. Data are summarized as mean and the error bars represent the SD. A 2-tailed Student t test (A and B), 1-way analysis of variance (ANOVA) followed by Tukey multiple comparison test (C, and F–H), and the Wilcoxon 2-sample test (E) were used to calculate P values. All statistical tests were 2-sided. FOXP3 = forkhead box p3.

