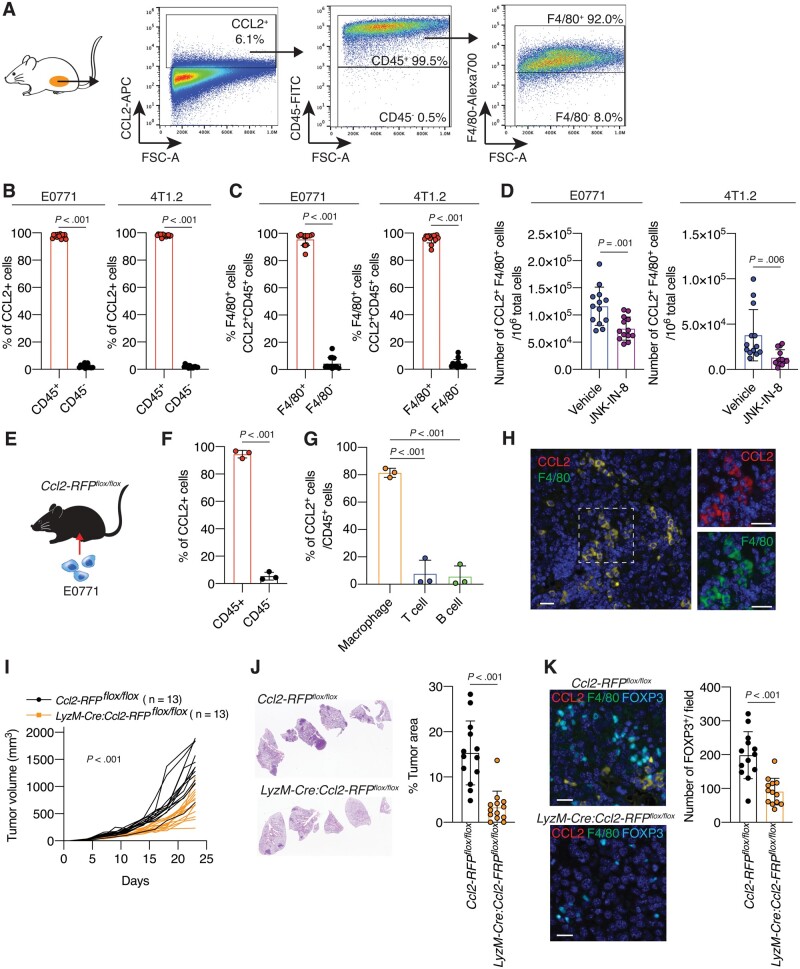
Figure 4.
The role of tumor-associated macrophages (TAMs) in producing C-C motif ligand 2 (CCL2) in the tumor microenvironment (TME) and triple-negative breast cancer (TNBC) tumor progression. A) Schematic of gating strategy of flow cytometry analysis. Tumors from E0771 or 4T1.2 mouse models were dissociated to obtain a single-cell suspension and stained with antibodies. Cells were first gated to exclude debris and dead cells (not shown), and CCL2+ cells were selected. Cells were further gated by cluster of differentiation 45 (CD45) and then F4/80 expression. Quantification of the percentage of (B) CD45+ or CD45– cells within the CCL2+ cells and (C) F4/80+ or F4/80– cells within the CCL2+CD45+ cells in tumors from 4T1.2 or E0771 models (n = 13). D) Quantification of the number of CCL2+CD45+F4/80+ cells in 106 tumor cells from vehicle- or JNK-IN-8–treated 4T1.2 and E0771 mouse models (n = 13 per group). E) Schematic of experimental design: E0771 cells were injected into Ccl2-RFPflox/flox mice. At 28 days after cell injection, mice were killed and tumors were subjected to further analysis. Quantification of the percentages of (F) CD45+ or CD45– cells within the CCL2-red fluorescent protein (RFP+) cells and (G) CCL2-RFP+F4/80+ cells (macrophages), CCL2-RFP+CD3+ cells (T cells), and CCL2-RFP+CD19+ cells (B cells) within the CD45+ cells in tumors from E0771-inoculated Ccl2-RFPflox/flox mice (n = 3). Also, see Supplementary Figure 4, A (available online). H) Multiplex immunohistochemistry (IHC) staining for CCL2-RFP (red) and F4/80 (green) of an E0771 tumor section from a Ccl2-RFPflox/flox mouse. Scale bar = 50 μm. I) Tumor growth curves for E0771 tumors in Ccl2-RFPflox/flox and LyzM-Cre: Ccl2-RFPflox/flox mice groups (n = 13 per group). J) H&E staining and quantification of the percentage tumor area within the lungs of mice from each group (n = 13). K) (left) Representative images of multiplex IHC of E0771 tumor sections from Ccl2-RFPflox/flox and LyzM-Cre: Ccl2-RFPflox/flox mice for CCL2-RFP (red), F4/80 (green), and forkhead box p3 (FOXP3) (cyan). Scale bar = 50 μm. (Right) Quantification of the number of FOXP3+ cells in tumors from each group (n = 13). Data are summarized as mean and error bars represent the SD. A 2-tailed Student t test (B-D, F, J, and K), 1-way analysis of variance (ANOVA) followed by Tukey multiple comparison test (G), and the Wilcoxon 2-sample test (I) were used to calculate P values. All statistical tests were 2-sided.

