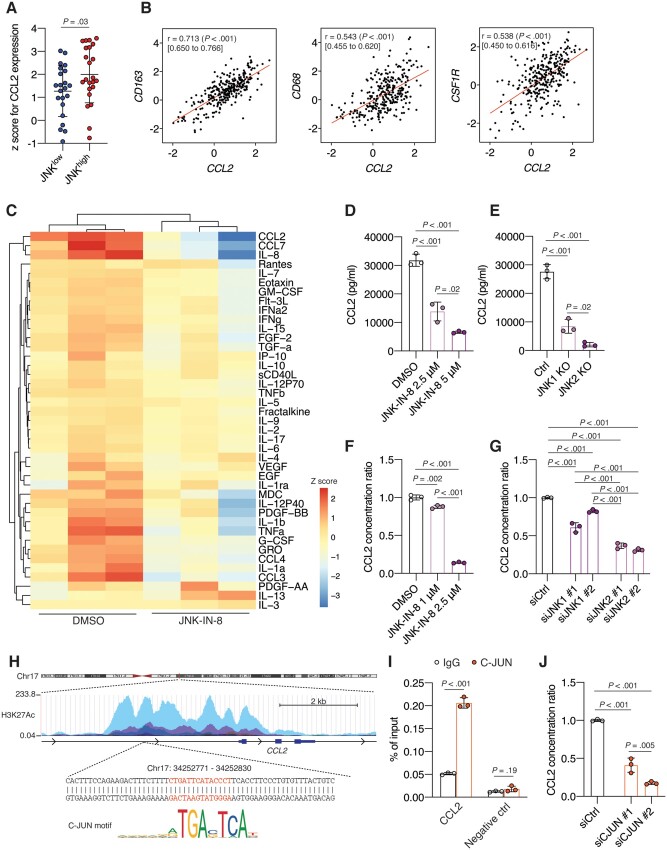
Figure 5.
The regulatory role of C-JUN N-terminal kinase (JNK)/C-JUN signaling pathway on C-C motif ligand 2 (CCL2) production in human macrophages. A) CCL2 mRNA expression in the JNKhigh (n = 22) and the JNKlow (n = 23) subgroups of triple-negative breast cancer (TNBC) patients from the The Cancer Genome Atlas (TCGA) cohort (n = 45). B) Scatterplots showing Spearman’s correlation coefficient r with 95% confidence interval (CI) of expression levels for CCL2 and cluster of differentiation 163 (CD163), CD68, or colony stimulation factor 1 recepto (CSF1R) mRNA expression in 299 TNBC patients from the Molecular Taxonomy of Breast Cancer International Consortium (METABRIC) cohort. C) Heatmap shows unsupervised hierarchical clustering of each cytokine or chemokine concentration in conditioned medium (CM) from dimethyl sulfoxide (DMSO) or 2.5 μM JNK-IN-8–treated M2 THP-1 cells as measured by Luminex assay. D) Quantification of the concentration of CCL2 in CM from M2 THP-1 cells treated with DMSO or 2.5 μM or 5 μM JNK-IN-8 (n = 3). E) Quantification of the fold change in CCL2 levels of CM from control (Ctrl), JNK1-knockout (KO), or JNK2-KO THP-1 cells (n = 3). F) Quantification of the fold change in CCL2 levels of CM from human primary macrophages treated with DMSO or 1 μM or 2.5 μM JNK-IN-8 (n = 3). G) Quantification of the fold change in CCL2 levels of CM from human primary macrophages in which JNK1 and JNK2 were silenced by siRNAs (n = 3). H) Schematic of the map of human chromosome 17, the genomic region upstream of CCL2, and the sequence with the C-JUN binding motif obtained from the University of California, Santa Cruz (UCSC) genome browser and Japan Automotive Software Platform and Architecture (JASPAR). I) Quantification of precipitated DNA by quantitative polymerase chain reaction (qPCR) in human primary macrophages following chromatin immunoprecipitation (ChIP) using an anti-C-JUN antibody or immunoglobulin G (IgG) antibody; the qPCR primer was specific to the CCL2 promoter region (CCL2) or intergenic region (negative ctrl). J) Quantification of the fold change in CCL2 level of CM from human primary macrophages in which siRNAs silenced C-JUN. Data are summarized as mean and error bars represent the SD. A 2-tailed Student t test (A and I) and 1-way analysis of variance (ANOVA) followed by Tukey multiple comparison tests (B, D-G, and J) were used to calculate P values. All statistical tests were 2-sided.

