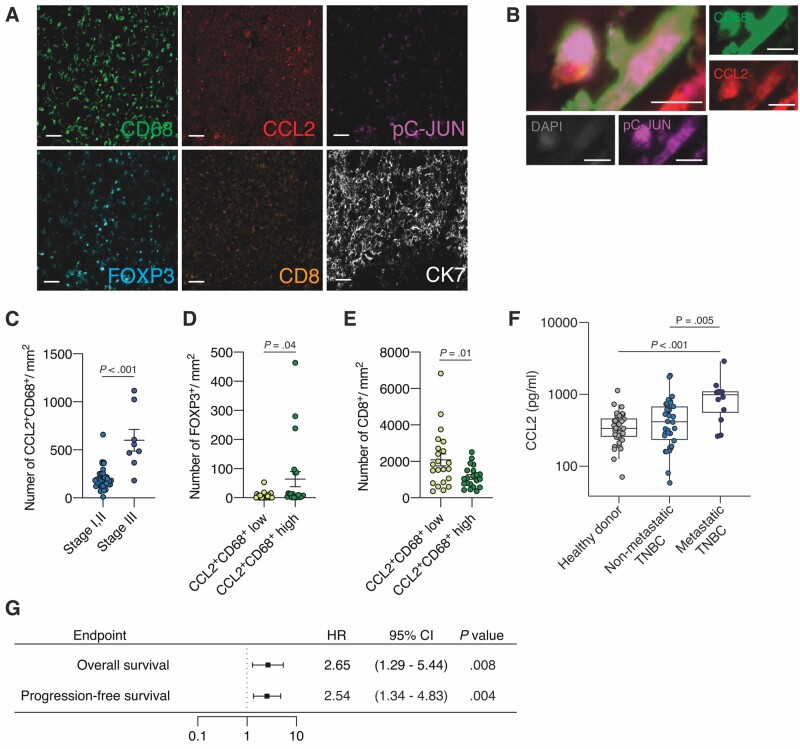
Figure 6.
Association of C-C motif ligand 2 (CCL2)-expressing tumor-associated macrophages (TAMs) with an immunosuppressive tumor microenvironment (TME), and the correlation between CCL2 serum concentration and prognosis of TNBC patients. A) Representative images of a triple-negative breast cancer (TNBC) section subjected to multiplex immunohistochemistry (IHC) for the following markers: cytokeratin 7 (CK7) (white), cluster of differentiation 68 (CD68) (green), CD8 (orange), pC-JUN (magenta), CCL2 (red), and forkhead box p3 (FOXP3) (cyan). Scale bar = 50 μm. B) Representative images of multiplex IHC of CCL2+pC-JUN+CD68+ macrophages: CD68 (green), pC-JUN (magenta), CCL2 (red), and 4′,6-diamidino-2-phenylindole (DAPI) (gray). Scale bar = 10 μm. C) Quantitation of the number of CCL2+CD68+ macrophages per area (mm2) in patients with stage I and II (n = 35) and stage III (n = 8) TNBC. D and E) Quantitation of the number of D) FOXP3+ regulatory T cells (Tregs) and E) CD8+ T cells per area (mm2) in tumors with high (n = 22) and low (n = 21) levels of CCL2+CD68+ macrophages. F) Quantification of the CCL2 concentration of sera previously collected at MD Anderson from healthy donors (n = 29), patients with nonmetastatic TNBC (n = 34), and patients with metastatic TNBC (n = 12). G) Hazard ratios (HRs; represented by squares) and 95% confidence intervals (CIs; represented by horizontal lines) for overall survival and progression-free survival of TNBC patients (n = 46) according to log-transformed CCL2 level in serum. A univariate Cox proportional-hazards model was used to estimate hazard ratios and the statistical significance of the comparison for survival. Data are summarized as mean and the error bars represent the SD (C-F). The Mann-Whitney test C-E) and Kruskal-Wallis H test F) were used to calculate P values. All statistical tests were 2-sided.

