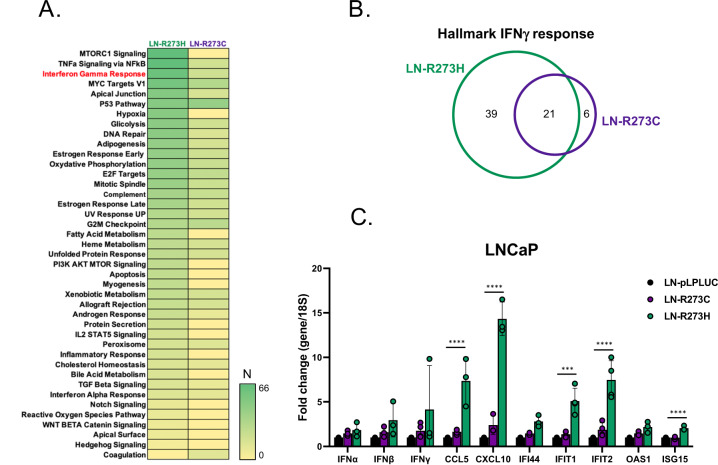
Fig. 5. Differential impact of R273C-p53 and R273H-p53 on induction of interferon-regulated genes.
A Cistrome analysis confirms IFNγ response as one of the top pathways specifically enriched in LN-R273H cell line: GSEA of all genes with TSS within 30 kb of p53 binding peaks specific for LN-R273C and LN-R273H cell lines compared to LN-pLPLUC control. N refers to number of genes enriched in each designated pathway. B Venn diagram shows overlap of genes from IFNγ response pathway specific to distinct mut-p53. C Expression levels of several representative members of IFNγ response pathway, including the genes identified both in cistrome (IFIT1 and ISG15) and transcriptome (CXCL10 and IFIT2) analyses as specific for LN-R273H cells. Two-way ANOVA test was used to determine statistical significance.

