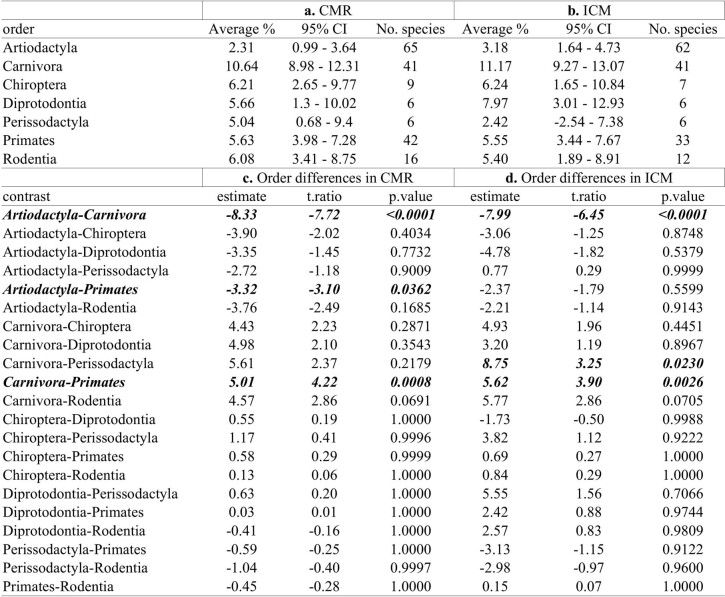
Extended Data Table 1.
Order differences in cancer mortality risk
measured as a, CMR or b, ICM. Only orders represented by a minimum of two species were included in these analyses. Models were constructed using R function "lm" using cancer mortality risks as a dependent variables and order as a sole predictor. Values presented are estimated marginal means and their associated 95% confidence intervals. The number of species for which data was available in each order is also shown. Post-hoc test of order differences in c, CMR or d, ICM across mammalian orders are shown.

