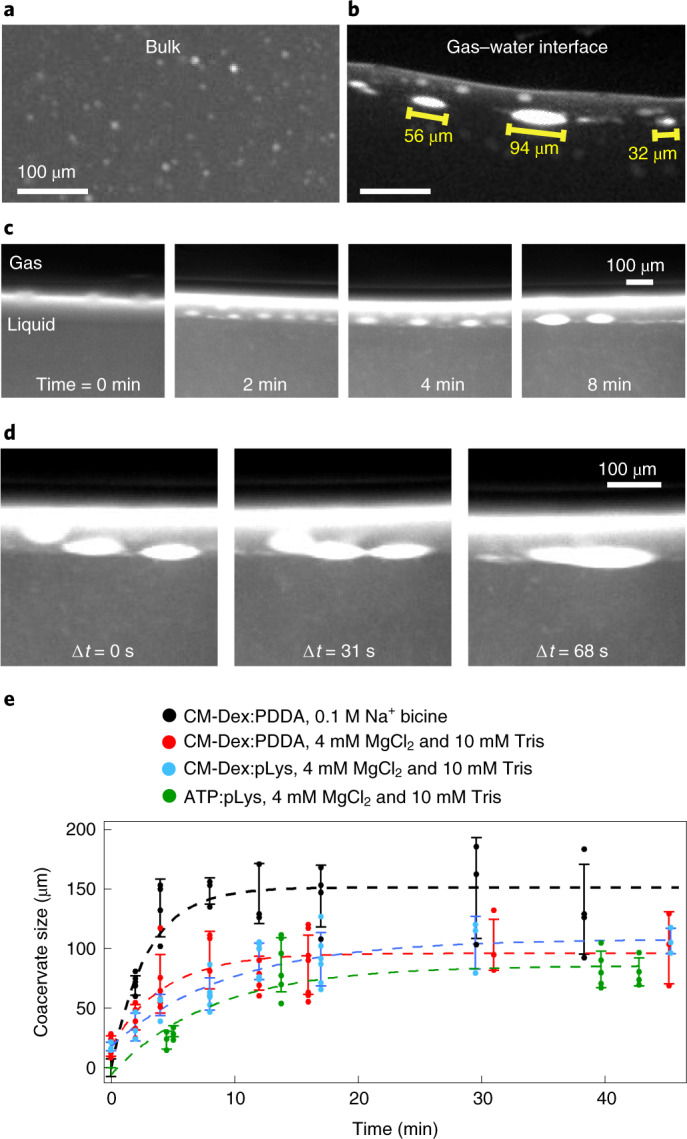
Fig. 3. Coacervate droplets accumulate and fuse at the gas–water interface.

a,b, Fluorescence microscopy images of coacervate droplets in bulk (a) and at the gas–water interface (b). On implementation of the thermal gradient, convective flows transport the coacervate droplets in the bulk to the gas–water interface where they fuse. Droplets will grow until they reach a steady-state size which is then maintained over time. c, Coacervate droplets at the interface (from left to right) at t = 0, 2, 4 and 8 min in a thermal gradient show progressive increase in droplet size. d, Microscopy images showing a fusion event between three coacervate droplets. e, Quantification of coacervate size over time for different buffer and coacervate compositions. Each data point represents the mean and standard deviation of approximately five different larger droplets at the gas–water interface. The dashed lines represent phenomenological exponential fits.
