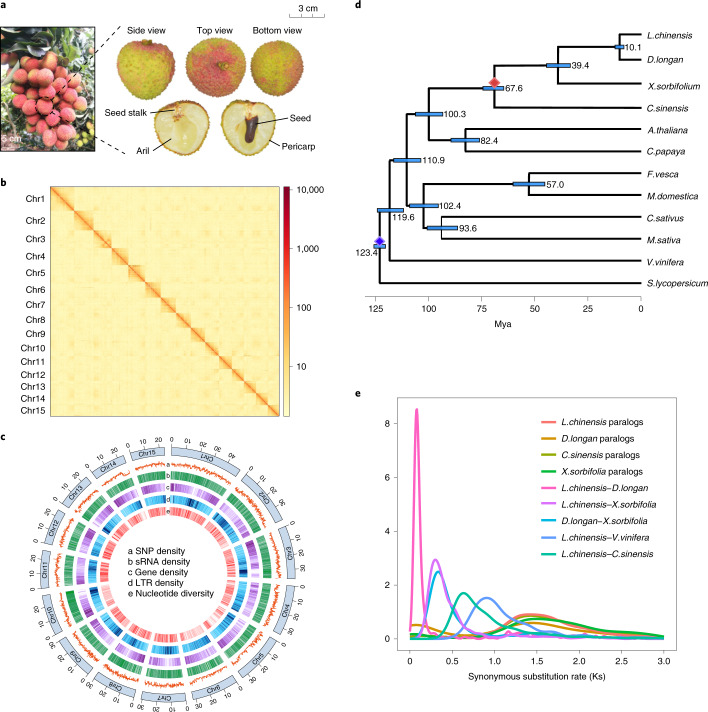
Fig. 1. Assembly, composition and evolution of the lychee genome.
a, Schematic presentation of lychee fruit. Scale bar, 5 cm (left), 3 cm (right). b, Contact map of Hi-C links among 15 pseudochromosomes. c, Lychee genomic features. d, Phylogenetic and molecular clock dating analysis of the lychee genome with 13 other species, based on single-copy orthogroup data. The red diamond indicates our fossil calibration point26, and the blue diamond represents S. lycopersicum divergence time27. The light blue bars at the internodes represent 95% confidence intervals for divergence times. e, Synonymous substitution rate (Ks) density distributions of syntenic lychee paralogs and orthologs compared with other eudicot species.

