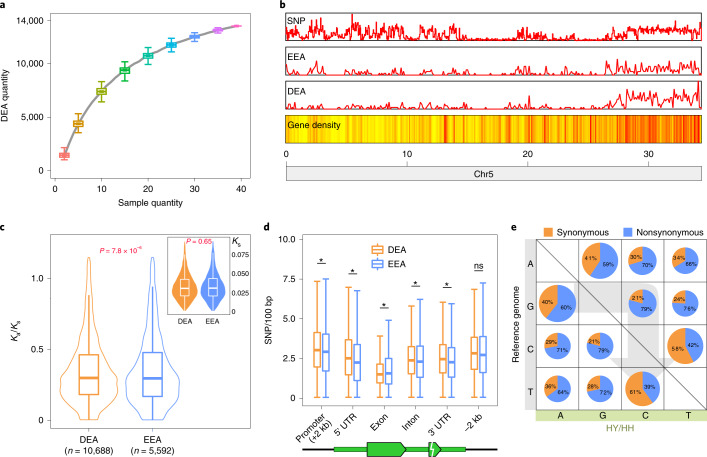
Fig. 4. DEAs in lychee.
a, DEA numbers increase with the quantity of RNA-seq libraries. The specified number sets were selected randomly from 39 DEA sets with 500 replicates. b, DEAs are unevenly distributed in the ‘Feizixiao’ genome. The gene density is represented by a yellow-to-red color scheme, with a redder color denoting a higher level of gene density. c, DEAs are of relatively lower Ka/Ks value. Minima and maxima are present in the lower and upper bounds of the whiskers, respectively, and the width of violin are densities of Ks or Ka/Ks value. P values were calculated with two-sided Student’s t-test. Numbers of genes: n = 10,688 (DEA); n = 5,592 (EEA). P = 0.65 for Ks, P = 7.8 × 10⁻⁶ for Ka/Ks. d, SNP density in gene features. The y axis represents SNP numbers every 100 bp. The asterisk indicates significance with two-sided Student’s t-test. The P values for promoter, 5′ UTR, exon, intron, 3′ UTR and −2 kb (2 kb sequence downstream of 3′ UTR) are P = 1.5 × 10⁻⁴, P = 2.0 × 10⁻¹⁵, P = 2.1 × 10−38, P = 0.047, P = 5.4 × 10⁻⁸ and P = 0.12, respectively, and their gene numbers of DEA versus EEA are n = 14244 versus n = 8679, n = 10312 versus n = 4472, n = 14244 versus n = 8679, n = 12426 versus n = 7569, n = 10284 versus n = 4463 and n = 14244 versus n = 8679, respectively. ns, not significant. e, The numbers of base pair transformations and their synonymous and nonsynonymous substitution rates. In a, c and d, box plots show the median, box edges represent the 25th and 75th percentiles and whiskers represent the maximum and minimum data points within 1.5× interquartile range outside box edges.

