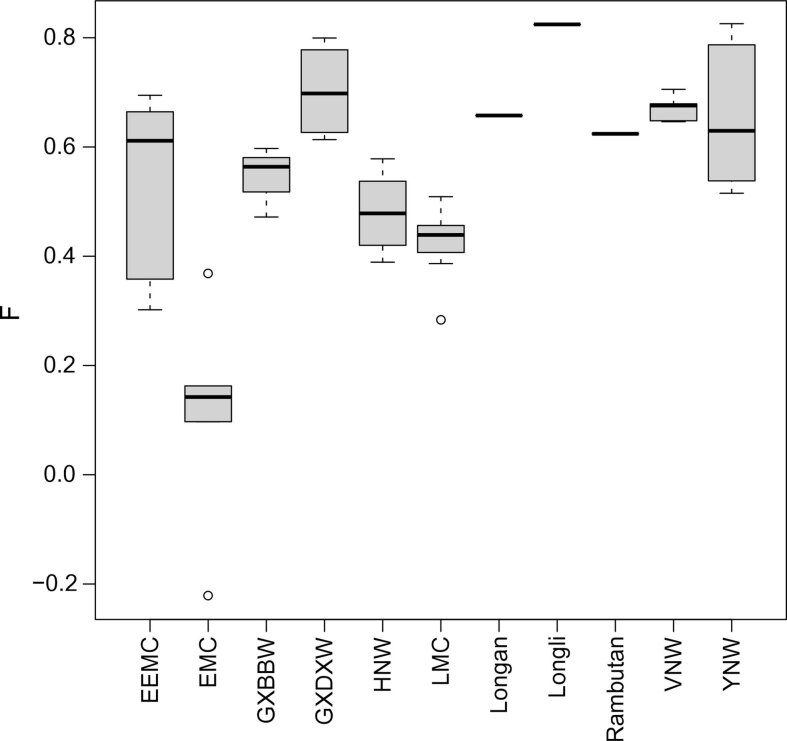
Extended Data Fig. 3. Inbreeding coefficients for different lychee subgroups.
Box plots show the inbreeding coefficients from subgroups with accession numbers (left to right) are n = 4, 6, 4, 4, 13, 25, 1, 1, 1, 5 and 12, total 73 lychee accessions and 3 outgroups, respectively. Bold black line shows the median, box edges represent the 25th and 75th percentiles, whiskers represent the maximum and minimum data points within 1.5× interquartile range outside box edges, empty circles represent the outlier data.

