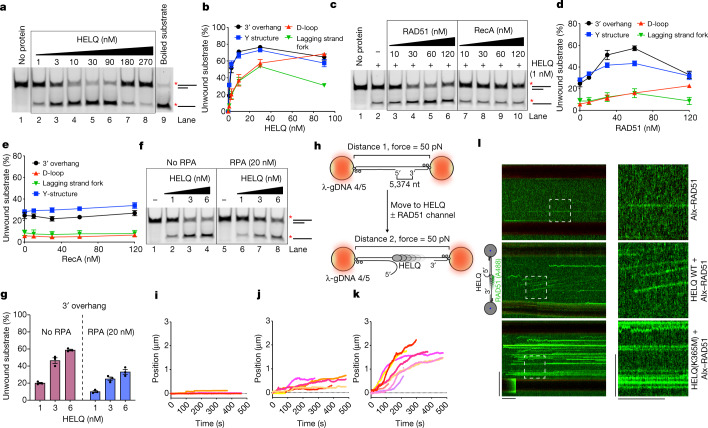
Fig. 1. RAD51 forms a co-complex with HELQ and stimulates HELQ unwinding activity.
a, Representative gel of the DNA unwinding assay with the indicated concentrations of HELQ with 3′ overhang substrate. The asterisk indicates the position of fluorescein isothiocyanate (FITC) labelling at 5′ end of the oligo. The products were resolved on a 10% native polyacrylamide gel. b, Quantification of the experiments such as shown in a and Extended Data Fig. 1b–d. HELQ concentrations of only 1–90 nM are shown. n = 4 independent experiments. Data are mean ± s.e.m. c, Representative gel of DNA unwinding of 3′ overhang substrate with HELQ and the indicated concentrations of RAD51 or RecA. d, e, Quantification of the experiments shown in c and Extended Data Fig. 2c, d for RAD51 (d) and RecA (e). n = 3 (3′ overhang), n = 4 (Y-structure), n = 3 (D-loop) and n = 3 (lagging strand fork) independent experiments. Data are mean ± s.e.m. f, Representative gel of the DNA unwinding assay of 3′ overhang substrate with the indicated concentrations of HELQ in the absence and presence of RPA (20 nM). g, Quantification of the experiments shown in f. n = 3 independent experiments. Data are mean ± s.e.m. h, Schematics of the experimental set-up of the optical tweezer (C-Trap) system to observe DNA unwinding. These experiments were performed at room temperature. i–k, Bead centre displacement measured between the traps as a function of time with 25 nM RAD51 (i), 50 nM HELQ (j), and 25 nM RAD51 and 50 nM HELQ (k). The traces represent individual DNA molecules (n ≥ 4). l, Representative kymographs of single Alx–RAD51 binding events on gapped DNA in the presence or absence of 50 nM HELQ or HELQ(K365M). Unidirectional movement of Alx–RAD51 indicates translocation of Alx–RAD51–HELQ complex. Scale bars, 60 s (horizontal), 10 µm (vertical, left), 5 µm (vertical, right).

